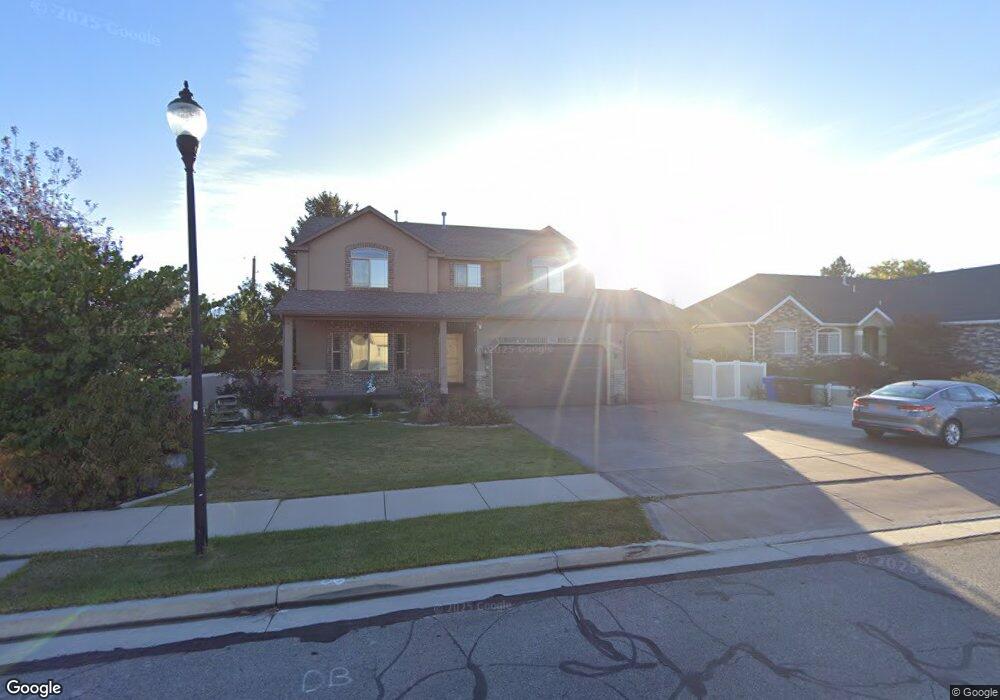
7013 Steadman Cir West Jordan, UT 84084
Estimated Value: $709,000 - $859,000
3
Beds
3
Baths
2,624
Sq Ft
$297/Sq Ft
Est. Value
About This Home
This home is located at 7013 Steadman Cir, West Jordan, UT 84084 and is currently estimated at $780,570, approximately $297 per square foot. 7013 Steadman Cir is a home located in Salt Lake County with nearby schools including West Jordan School, Westland Elementary School, and West Jordan Middle School.
Ownership History
Date
Name
Owned For
Owner Type
Purchase Details
Closed on
May 17, 2021
Sold by
Phan Quang Ngoc
Bought by
Dang Jackie Quoc and Tran My H
Current Estimated Value
Home Financials for this Owner
Home Financials are based on the most recent Mortgage that was taken out on this home.
Original Mortgage
$560,456
Outstanding Balance
$507,913
Interest Rate
3.1%
Mortgage Type
New Conventional
Estimated Equity
$272,657
Purchase Details
Closed on
Mar 30, 2021
Sold by
Pham Thang Ngoc and Luu Loan Thi
Bought by
Pham Quang Ngoc
Home Financials for this Owner
Home Financials are based on the most recent Mortgage that was taken out on this home.
Original Mortgage
$560,456
Outstanding Balance
$507,913
Interest Rate
3.1%
Mortgage Type
New Conventional
Estimated Equity
$272,657
Purchase Details
Closed on
Feb 28, 2018
Sold by
Pham Hien T and Do Ly
Bought by
Pham Thang Ngoc and Luu Loan Thi
Purchase Details
Closed on
Aug 27, 2010
Sold by
Kehl Homes Inc
Bought by
Pham Hien T and Do Ly
Home Financials for this Owner
Home Financials are based on the most recent Mortgage that was taken out on this home.
Original Mortgage
$334,988
Interest Rate
4.5%
Mortgage Type
FHA
Purchase Details
Closed on
Jan 4, 2007
Sold by
Harper Wayne
Bought by
Dws Ventures Llc
Purchase Details
Closed on
Dec 5, 2006
Sold by
Harper Wayne
Bought by
Dws Ventures Llc
Purchase Details
Closed on
Sep 23, 2006
Sold by
Poole Ruby R
Bought by
Harper Wayne
Purchase Details
Closed on
Jun 23, 2000
Sold by
Poole Carl B
Bought by
Poole Ruby R
Home Financials for this Owner
Home Financials are based on the most recent Mortgage that was taken out on this home.
Original Mortgage
$93,000
Interest Rate
8.67%
Purchase Details
Closed on
Sep 10, 1999
Sold by
Northern Virginia I and Northern Delbert R
Bought by
Poole Carl B and Poole Ruby R
Purchase Details
Closed on
Oct 8, 1997
Sold by
Northern Delbert R and Northern Virginia I
Bought by
Northern Virginia I and Northern Delbert R
Home Financials for this Owner
Home Financials are based on the most recent Mortgage that was taken out on this home.
Original Mortgage
$117,000
Interest Rate
7.54%
Create a Home Valuation Report for This Property
The Home Valuation Report is an in-depth analysis detailing your home's value as well as a comparison with similar homes in the area
Home Values in the Area
Average Home Value in this Area
Purchase History
| Date | Buyer | Sale Price | Title Company |
|---|---|---|---|
| Dang Jackie Quoc | -- | Highland Title Agency | |
| Pham Quang Ngoc | -- | Real Advantage Ttl Ins Agcy | |
| Pham Thang Ngoc | -- | Accommodation | |
| Pham Hien T | -- | Metro National Title | |
| Dws Ventures Llc | -- | Monument Title Ins Co | |
| Dws Ventures Llc | -- | Monument Title Ins Co | |
| Harper Wayne | -- | Monument Title Ins Co | |
| Poole Ruby R | -- | Equity Title | |
| Poole Carl B | -- | Equity Title | |
| Northern Virginia I | -- | -- |
Source: Public Records
Mortgage History
| Date | Status | Borrower | Loan Amount |
|---|---|---|---|
| Open | Dang Jackie Quoc | $560,456 | |
| Previous Owner | Pham Hien T | $334,988 | |
| Previous Owner | Poole Ruby R | $93,000 | |
| Previous Owner | Northern Virginia I | $117,000 |
Source: Public Records
Tax History Compared to Growth
Tax History
| Year | Tax Paid | Tax Assessment Tax Assessment Total Assessment is a certain percentage of the fair market value that is determined by local assessors to be the total taxable value of land and additions on the property. | Land | Improvement |
|---|---|---|---|---|
| 2025 | $3,752 | $773,000 | $140,700 | $632,300 |
| 2024 | $3,752 | $721,800 | $135,300 | $586,500 |
| 2023 | $3,875 | $702,600 | $134,000 | $568,600 |
| 2022 | $3,973 | $708,800 | $131,300 | $577,500 |
| 2021 | $3,275 | $531,900 | $109,400 | $422,500 |
| 2020 | $3,326 | $506,900 | $109,400 | $397,500 |
| 2019 | $3,263 | $487,600 | $91,900 | $395,700 |
| 2018 | $3,060 | $453,600 | $90,700 | $362,900 |
| 2017 | $2,881 | $425,200 | $90,700 | $334,500 |
| 2016 | $2,848 | $394,900 | $90,700 | $304,200 |
| 2015 | $2,733 | $369,500 | $92,300 | $277,200 |
| 2014 | $2,482 | $330,300 | $83,700 | $246,600 |
Source: Public Records
Map
Nearby Homes
- 2421 W 6900 S
- 2312 W Hidden Bend Cove Unit 107
- 6918 S Harvest Cir
- 6924 S 2160 W
- 2683 W Carson Ln
- 6925 S Lexington Dr
- 7361 S 2700 W
- 1951 W 7125 S
- 7150 Camelot Way
- 2510 W Jordan Meadows Ln
- 8524 S Michele River Ave W Unit 109
- 7149 S Camelot Way
- 2573 Jordan Meadows Ln
- 7279 S Kenadi Ct
- 6683 Alice Susanna Ln
- 2333 W Ledgewood Dr
- 1718 W Trey Way Unit 2
- 6893 S 3200 W
- 7647 S 2500 W
- 2169 W 7600 S
- 7033 S Steadman Cir
- 7021 S Steadman Cir
- 7032 S 2400 W
- 7033 Steadman Cir
- 2469 W 7000 S Unit 206
- 7048 S 2400 W
- 7041 Steadman Cir
- 7013 S Steadman Cir
- 7016 S 2400 W
- 7012 S Steadman Cir
- 7028 S Steadman Cir
- 7034 S Steadman Cir
- 2464 Beverly Glen Ave
- 7031 S 2400 W
- 7080 S 2400 W
- 2478 Beverly Glen Ave
- 2477 W 7000 S
- 7047 S 2400 W
- 7015 S 2400 W
- 2444 W 7000 S