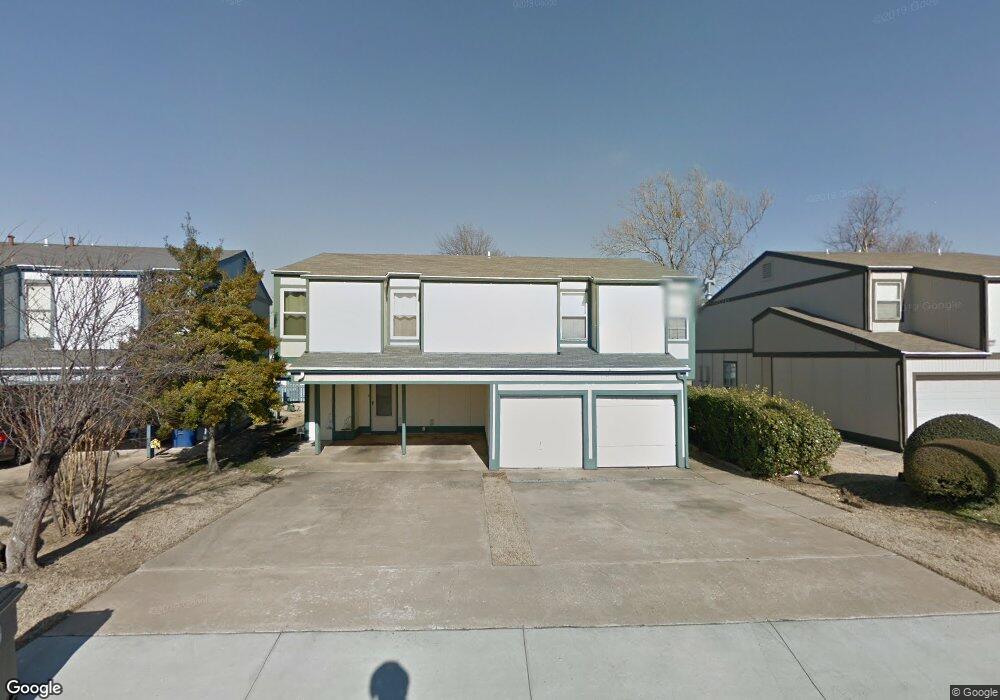
7015 E 33rd St Unit 14-102 Tulsa, OK 74145
Johansen Acres NeighborhoodEstimated Value: $122,000 - $131,000
3
Beds
2
Baths
1,221
Sq Ft
$104/Sq Ft
Est. Value
About This Home
This home is located at 7015 E 33rd St Unit 14-102, Tulsa, OK 74145 and is currently estimated at $126,623, approximately $103 per square foot. 7015 E 33rd St Unit 14-102 is a home located in Tulsa County with nearby schools including Macarthur Elementary School, Nathan Hale High School, and Augustine Christian Academy.
Ownership History
Date
Name
Owned For
Owner Type
Purchase Details
Closed on
Nov 12, 2020
Sold by
Johnson Bridget and Johnson Peter K
Bought by
Drake Andrea
Current Estimated Value
Home Financials for this Owner
Home Financials are based on the most recent Mortgage that was taken out on this home.
Original Mortgage
$76,000
Outstanding Balance
$67,320
Interest Rate
2.8%
Mortgage Type
New Conventional
Estimated Equity
$59,303
Purchase Details
Closed on
Jan 8, 2013
Sold by
Johnson Bridget and Johnson Peter K
Bought by
Johnson Bridget and Johnson Peter K
Purchase Details
Closed on
Nov 27, 1998
Sold by
Roberts John P and Roberts Ann M
Bought by
Jensen Peter and Jensen Stephanie
Home Financials for this Owner
Home Financials are based on the most recent Mortgage that was taken out on this home.
Original Mortgage
$35,000
Interest Rate
6.69%
Mortgage Type
Purchase Money Mortgage
Create a Home Valuation Report for This Property
The Home Valuation Report is an in-depth analysis detailing your home's value as well as a comparison with similar homes in the area
Home Values in the Area
Average Home Value in this Area
Purchase History
| Date | Buyer | Sale Price | Title Company |
|---|---|---|---|
| Drake Andrea | $80,000 | Apex Title & Closing Svcs | |
| Johnson Bridget | -- | None Available | |
| Jensen Peter | $47,000 | -- |
Source: Public Records
Mortgage History
| Date | Status | Borrower | Loan Amount |
|---|---|---|---|
| Open | Drake Andrea | $76,000 | |
| Previous Owner | Jensen Peter | $35,000 |
Source: Public Records
Tax History
| Year | Tax Paid | Tax Assessment Tax Assessment Total Assessment is a certain percentage of the fair market value that is determined by local assessors to be the total taxable value of land and additions on the property. | Land | Improvement |
|---|---|---|---|---|
| 2025 | $1,238 | $9,240 | $812 | $8,428 |
| 2024 | $1,117 | $8,800 | $1,133 | $7,667 |
| 2023 | $1,117 | $8,800 | $1,133 | $7,667 |
| 2022 | $1,173 | $8,800 | $1,133 | $7,667 |
| 2021 | $1,162 | $8,800 | $1,133 | $7,667 |
| 2020 | $873 | $6,700 | $986 | $5,714 |
| 2019 | $918 | $6,700 | $986 | $5,714 |
| 2018 | $920 | $6,700 | $986 | $5,714 |
| 2017 | $918 | $7,700 | $1,133 | $6,567 |
| 2016 | $899 | $7,700 | $1,133 | $6,567 |
| 2015 | $901 | $7,700 | $1,133 | $6,567 |
| 2014 | $893 | $7,700 | $1,133 | $6,567 |
Source: Public Records
Map
Nearby Homes
- 3221 S 70th East Ave
- 6717 E 30th St
- 7484 E 30th Place
- 7454 E 29th St
- 7470 E 29th St
- 0 E 31st St S Unit 2603272
- 6629 E 28th St
- 7731 E Skelly Dr
- 2717 S 74th East Ave
- 6719 E 27th Place
- 6531 E 28th St
- 6759 E 26th Ct
- 6604 E 26th Ct
- 8109 E 31st Place
- 3027 S Joplin Ave
- 6781 E 26th Place
- 2605 E 74th Place
- 7925 E 27th Ct
- 5825 E 36th St
- 7320 E 24th St
- 7017 E 33rd St Unit 14
- 7017 E 33rd St Unit 101
- 7017 E 33rd St Unit 101/14
- 7015 E 33rd St Unit 14
- 7015 E 33rd St Unit 102-BLDG14
- 7011 E 33rd St Unit 13
- 7011 E 33rd St Unit 104
- 7011 E 33rd St Unit 104-13
- 7011 E 33rd St Unit 13-10
- 7021 E 33rd St Unit 15
- 7021 E 33rd St Unit 99
- 7021 E 33rd St Unit 1599
- 7021 E 33rd St Unit 99-15
- 7019 E 33rd St Unit 15
- 7019 E 33rd St Unit 100/15
- 7019 E 33rd St Unit 15100
- 7013 E 33rd St Unit 13
- 7013 E 33rd St Unit 13103
- 7208 E 32nd Place Unit 31
- 7206 E 32nd Place Unit 31
Your Personal Tour Guide
Ask me questions while you tour the home.