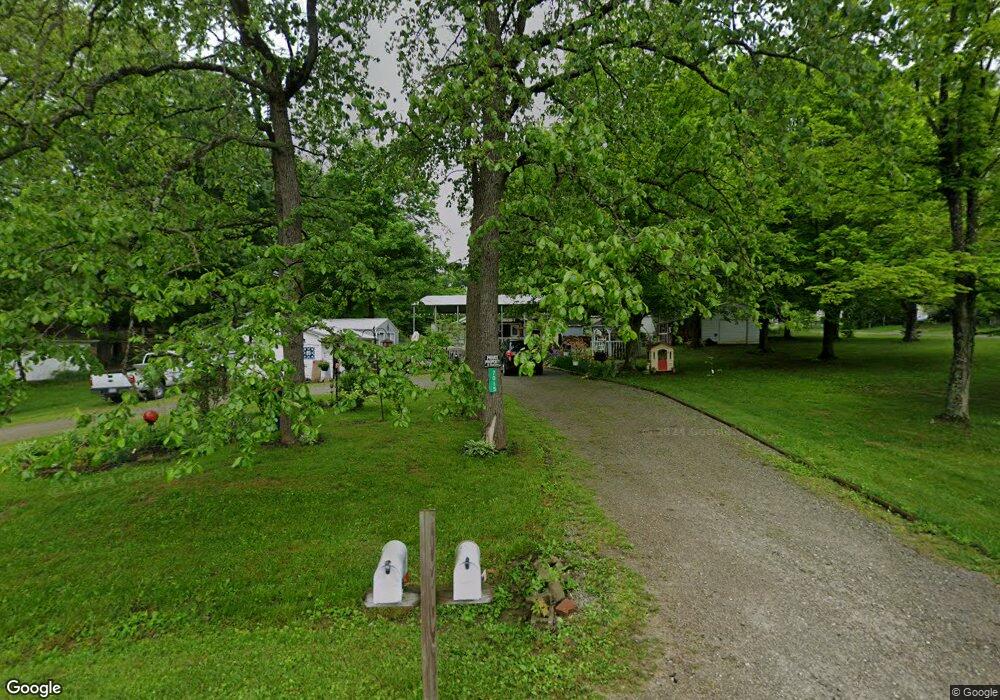
7015 Highland Trail W Unit TLW Hillsboro, OH 45133
Estimated Value: $35,000 - $172,000
--
Bed
1
Bath
1,008
Sq Ft
$111/Sq Ft
Est. Value
About This Home
This home is located at 7015 Highland Trail W Unit TLW, Hillsboro, OH 45133 and is currently estimated at $111,983, approximately $111 per square foot. 7015 Highland Trail W Unit TLW is a home located in Highland County with nearby schools including Hillsboro Primary School, Hillsboro Middle School, and Hillsboro High School.
Ownership History
Date
Name
Owned For
Owner Type
Purchase Details
Closed on
Oct 25, 2019
Sold by
Paladin Group Inc
Bought by
Weaver Clifford W and Weaver Rhonda J
Current Estimated Value
Purchase Details
Closed on
Nov 17, 2010
Sold by
Moon Vicki K
Bought by
Hopkins Christy and Hopkins Ralph
Home Financials for this Owner
Home Financials are based on the most recent Mortgage that was taken out on this home.
Original Mortgage
$63,900
Interest Rate
6%
Mortgage Type
Seller Take Back
Purchase Details
Closed on
Aug 31, 2007
Sold by
Merrick Marlin L
Bought by
Moon Vicki
Purchase Details
Closed on
Sep 9, 2005
Sold by
Dressman Kenneth and Dressman Irene
Bought by
Merrick Marlin L
Purchase Details
Closed on
Jan 1, 1990
Bought by
Dressman Kenneth L
Create a Home Valuation Report for This Property
The Home Valuation Report is an in-depth analysis detailing your home's value as well as a comparison with similar homes in the area
Home Values in the Area
Average Home Value in this Area
Purchase History
| Date | Buyer | Sale Price | Title Company |
|---|---|---|---|
| Weaver Clifford W | $11,417 | None Available | |
| Hopkins Christy | $68,900 | Attorney | |
| Moon Vicki | $68,000 | Attorney | |
| Merrick Marlin L | $32,000 | Technetitle Agency | |
| Dressman Kenneth L | -- | -- |
Source: Public Records
Mortgage History
| Date | Status | Borrower | Loan Amount |
|---|---|---|---|
| Previous Owner | Hopkins Christy | $63,900 |
Source: Public Records
Tax History Compared to Growth
Tax History
| Year | Tax Paid | Tax Assessment Tax Assessment Total Assessment is a certain percentage of the fair market value that is determined by local assessors to be the total taxable value of land and additions on the property. | Land | Improvement |
|---|---|---|---|---|
| 2024 | $660 | $19,150 | $8,860 | $10,290 |
| 2023 | $660 | $15,650 | $7,180 | $8,470 |
| 2022 | $320 | $8,440 | $7,180 | $1,260 |
| 2021 | $307 | $8,440 | $7,180 | $1,260 |
| 2020 | $287 | $7,670 | $6,510 | $1,160 |
| 2019 | $98 | $2,700 | $1,540 | $1,160 |
| 2018 | $89 | $1,540 | $1,540 | $0 |
| 2017 | $121 | $3,330 | $1,370 | $1,960 |
| 2016 | $122 | $3,330 | $1,370 | $1,960 |
| 2015 | $63 | $3,330 | $1,370 | $1,960 |
| 2014 | $133 | $3,330 | $1,370 | $1,960 |
| 2013 | $66 | $3,330 | $1,370 | $1,960 |
Source: Public Records
Map
Nearby Homes
- 6949 Highland Trail W Unit TLW
- 7069 Forest Cove Cir
- acres +- N Beach Rd
- 11515 Dundee Dr
- 0 N Shore Rd Unit 1845070
- 6749 Loch Lomond Cir
- 57+-AC N Shore Dr
- 6628 Park Ln
- 6553 Wizard of Oz Way
- 6555 Wizard of Oz Way
- 11850 Maple Trail
- 11907 Fern Ln
- 6549 Wizard of Oz Way
- 6613 Wizard of Oz Way
- 7094 Cedar Trail
- 6565 Fascination Way
- 0 Martha Dr Unit 1857951
- 6532 Beechwood Ln
- 6609 Fascination Way
- 6607 Fascination Way
- 7015 Highland Trail W
- 7005 Highland Trail W
- 7071 Highland Trail W
- 7021 Campfire Cove Cir
- 7021 Campfire Cove
- 7001 Highland Trail W
- 6996 Highland Trail W
- 7023 Campfire Cove
- 7016 Highland Trail W
- 7004 Highland Trail W
- 7025 Campfire Cove
- 7047 Highland Trail W
- 7041 Highland Trail W
- 6998 Carlisle Ln
- 7000 Highland Trail W Unit TLW
- 7000 Highland Trail W
- 7027 Campfire Cove
- 6976 Carlisle Ln
- 6976 Carlisle Ln
- 7034 Highland Trail W