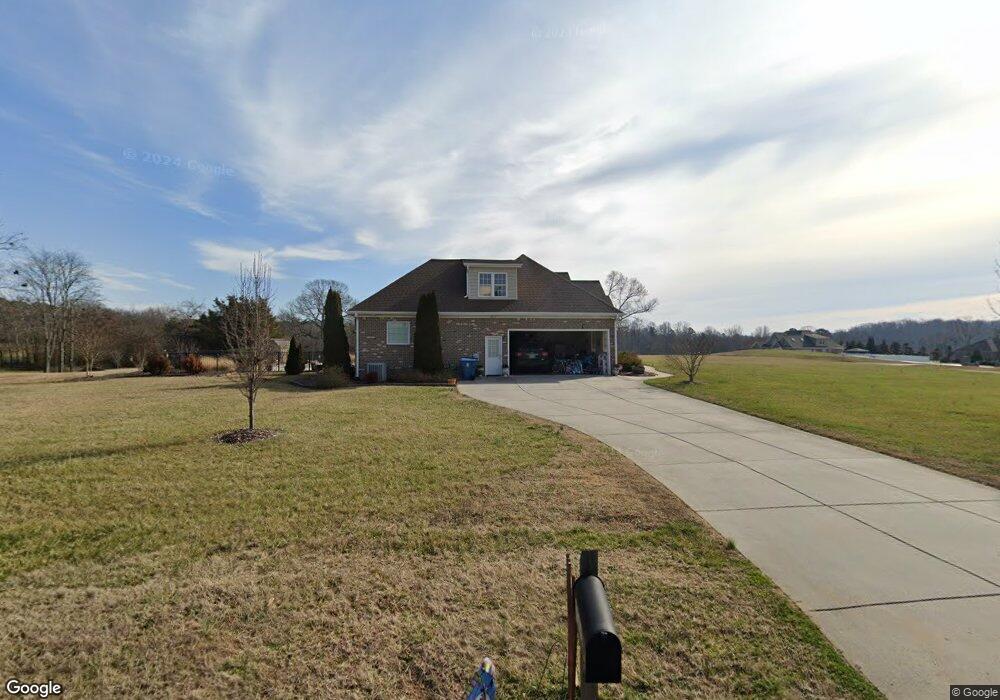
7015 Holly Hill Rd Randleman, NC 27317
Hodgin Valley NeighborhoodEstimated Value: $367,000 - $458,600
3
Beds
2
Baths
2,007
Sq Ft
$205/Sq Ft
Est. Value
About This Home
This home is located at 7015 Holly Hill Rd, Randleman, NC 27317 and is currently estimated at $410,650, approximately $204 per square foot. 7015 Holly Hill Rd is a home located in Guilford County with nearby schools including Southern Guilford Middle and Southern Guilford High School.
Ownership History
Date
Name
Owned For
Owner Type
Purchase Details
Closed on
Apr 6, 2017
Sold by
Carpenter Glenda M and Carpenter David A
Bought by
Duncan Jeffrey Matthews and Duncan Tracy Marie
Current Estimated Value
Purchase Details
Closed on
Nov 10, 2008
Sold by
Duncan Jeffrey Matthew and Whitaker Tracey Marie
Bought by
Whitaker Duncan Jeffrey Matthew and Whitaker Duncan Tracey
Purchase Details
Closed on
Jun 25, 2008
Sold by
Gb Development Llc
Bought by
Duncan Jeffrey Matthews and Whitaker Tracy Marie
Home Financials for this Owner
Home Financials are based on the most recent Mortgage that was taken out on this home.
Original Mortgage
$232,750
Interest Rate
5.97%
Mortgage Type
Construction
Purchase Details
Closed on
May 25, 2007
Bought by
Gossett Construction Company
Create a Home Valuation Report for This Property
The Home Valuation Report is an in-depth analysis detailing your home's value as well as a comparison with similar homes in the area
Home Values in the Area
Average Home Value in this Area
Purchase History
| Date | Buyer | Sale Price | Title Company |
|---|---|---|---|
| Duncan Jeffrey Matthews | -- | None Available | |
| Whitaker Duncan Jeffrey Matthew | -- | None Available | |
| Duncan Jeffrey Matthews | $39,000 | None Available | |
| Gossett Construction Company | -- | -- |
Source: Public Records
Mortgage History
| Date | Status | Borrower | Loan Amount |
|---|---|---|---|
| Previous Owner | Duncan Jeffrey Matthews | $232,750 |
Source: Public Records
Tax History Compared to Growth
Tax History
| Year | Tax Paid | Tax Assessment Tax Assessment Total Assessment is a certain percentage of the fair market value that is determined by local assessors to be the total taxable value of land and additions on the property. | Land | Improvement |
|---|---|---|---|---|
| 2025 | $2,547 | $293,500 | $39,900 | $253,600 |
| 2024 | $2,547 | $293,500 | $39,900 | $253,600 |
| 2023 | $2,547 | $293,500 | $39,900 | $253,600 |
| 2022 | $2,547 | $293,500 | $39,900 | $253,600 |
| 2021 | $2,305 | $265,600 | $37,700 | $227,900 |
| 2020 | $2,305 | $265,600 | $37,700 | $227,900 |
| 2019 | $2,259 | $265,600 | $0 | $0 |
| 2018 | $2,248 | $265,600 | $0 | $0 |
| 2017 | $2,248 | $265,600 | $0 | $0 |
| 2016 | $2,123 | $246,000 | $0 | $0 |
| 2015 | $2,135 | $246,000 | $0 | $0 |
| 2014 | $2,043 | $246,000 | $0 | $0 |
Source: Public Records
Map
Nearby Homes
- 6718 Thurber Rd
- 6700 Thurber Rd
- 434 Nc Highway 62 W
- 6882 Kelly Coltrane Dr
- 6802 Kerr Dr
- 130 W Steeple Chase Rd
- 0 Randleman Rd
- 6087 Old Walker Mill Rd
- 5770 Drake Rd
- 2060 Coltrane Mill Rd
- 0 Tom Ball Rd
- 5509,5505,5505zz, 55 Drake Rd
- 1139 Kentmere Rd
- 6904 Campbell Rd
- 1116 Kentmere Rd
- 506 Stonewell Ct
- 6407 Gardenview Rd
- 513 Stonewell Ct
- 513 Stonewell Ct Unit 38
- 413 Stonewell Ct
- 109 Steeple View Dr
- 116 Steeple View Dr
- 7011 Holly Hill Rd
- 7109 Steeple Valley Dr
- 113 Steeple View Dr
- 7010 Holly Hill Rd
- 7101 Steeple Valley Dr
- 7104 Steeple Valley Dr
- 7101 Steeple View Ct
- 7105 Steeple Valley Dr
- 7103 Steeple View Ct
- 7003 Holly Hill Rd
- 147 Nc Highway 62 W
- 7100 Steeple View Ct
- 201 Nc Highway 62 W
- 108 Steeple View Dr
- 7105 Steeple View Ct
- 203 Nc Highway 62 W
- 141 Nc Highway 62 W
- 7107 Steeple View Ct