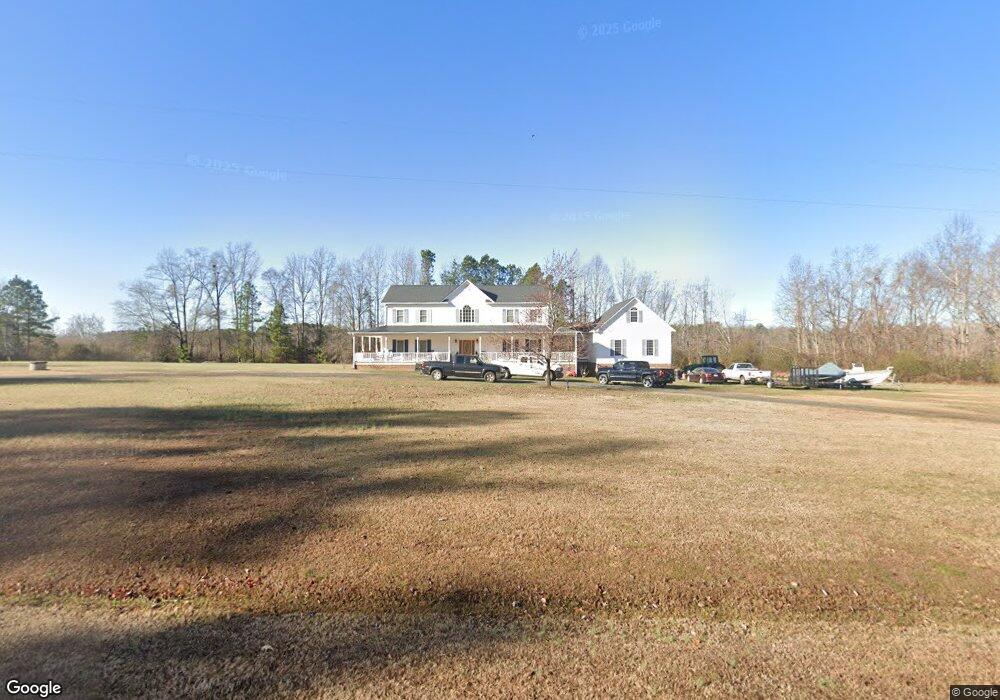
7015 Matt Currin Rd Oxford, NC 27565
Estimated Value: $580,000 - $683,000
4
Beds
3
Baths
2,906
Sq Ft
$216/Sq Ft
Est. Value
About This Home
This home is located at 7015 Matt Currin Rd, Oxford, NC 27565 and is currently estimated at $627,337, approximately $215 per square foot. 7015 Matt Currin Rd is a home located in Granville County with nearby schools including Stovall-Shaw Elementary School, Northern Granville Middle School, and J.F. Webb High School.
Ownership History
Date
Name
Owned For
Owner Type
Purchase Details
Closed on
Jan 6, 2025
Sold by
Waugh James Harold and Waugh Anita Migol
Bought by
Waugh James Harold and Waugh Anita Migol
Current Estimated Value
Purchase Details
Closed on
Jul 7, 2008
Sold by
Federal National Mortgage Association
Bought by
Waugh James and Waugh Anita
Home Financials for this Owner
Home Financials are based on the most recent Mortgage that was taken out on this home.
Original Mortgage
$19,500
Interest Rate
5.96%
Mortgage Type
Future Advance Clause Open End Mortgage
Purchase Details
Closed on
Jan 15, 2008
Sold by
Spencer Jamie L and Spencer Daniel K
Bought by
Fannie Mae
Create a Home Valuation Report for This Property
The Home Valuation Report is an in-depth analysis detailing your home's value as well as a comparison with similar homes in the area
Home Values in the Area
Average Home Value in this Area
Purchase History
| Date | Buyer | Sale Price | Title Company |
|---|---|---|---|
| Waugh James Harold | -- | None Listed On Document | |
| James Harold Waugh Jr And Anita Migol Waugh I | -- | None Listed On Document | |
| Waugh James Harold | -- | None Listed On Document | |
| Waugh James | -- | -- | |
| Fannie Mae | $234,000 | -- |
Source: Public Records
Mortgage History
| Date | Status | Borrower | Loan Amount |
|---|---|---|---|
| Previous Owner | Waugh James | $19,500 |
Source: Public Records
Tax History Compared to Growth
Tax History
| Year | Tax Paid | Tax Assessment Tax Assessment Total Assessment is a certain percentage of the fair market value that is determined by local assessors to be the total taxable value of land and additions on the property. | Land | Improvement |
|---|---|---|---|---|
| 2025 | $3,918 | $567,079 | $32,104 | $534,975 |
| 2024 | $3,918 | $567,079 | $32,104 | $534,975 |
| 2023 | $2,906 | $323,112 | $19,773 | $303,339 |
| 2022 | $2,939 | $323,112 | $19,773 | $303,339 |
| 2021 | $2,740 | $323,112 | $19,773 | $303,339 |
| 2020 | $2,742 | $323,112 | $19,773 | $303,339 |
| 2019 | $2,740 | $323,112 | $19,773 | $303,339 |
| 2018 | $2,742 | $323,112 | $19,773 | $303,339 |
| 2016 | $2,791 | $313,973 | $21,848 | $292,125 |
| 2015 | $2,629 | $313,973 | $21,848 | $292,125 |
| 2014 | $2,629 | $313,973 | $21,848 | $292,125 |
| 2013 | -- | $313,973 | $21,848 | $292,125 |
Source: Public Records
Map
Nearby Homes
- 3663 Chewning Rd
- 6647 Woodlawn Dr
- 3577 Dozer Ln
- 3506 Cascade Ct
- 4067 Chewning Rd
- 6663 Harold Obrien Rd
- 6527 U S 15
- 7085 Bayberry Dr
- 6561 Huntsboro Rd
- 001 Sam Young Rd
- . Sam Young Rd
- 3679 Oak Lawn Farm Rd
- 101 Cambridge Way
- 203 Kipling Dr
- 126 Kipling Dr
- 105 Byron Ct
- 7567 Sam Hall Rd
- 00 Salem Rd
- 200 W Westbury Dr
- 2665 Bodie Currin Rd
- 7008 Matt Currin Rd
- 7018 Matt Currin Rd
- 7018 Matt Currin Rd
- 7014 Matt Currin Rd
- 6703 Matt Currin Rd
- 7026 Matt Currin Rd
- 7021 Matt Currin Rd
- 6694 Matt Currin Rd
- 7030 Matt Currin Rd
- 7028 Matt Currin Rd
- 6685 Matt Currin Rd
- 7040 Matt Currin Rd
- 7040 Matt Currin Rd
- 7014 Red Oak Cir
- 6670 Matt Currin Rd
- 7051 Matt Currin Rd
- 1009 Red Oak Cir
- 6675 Poplar Creek Rd
- 6683 Poplar Creek Rd
- 3611 Chewning Rd