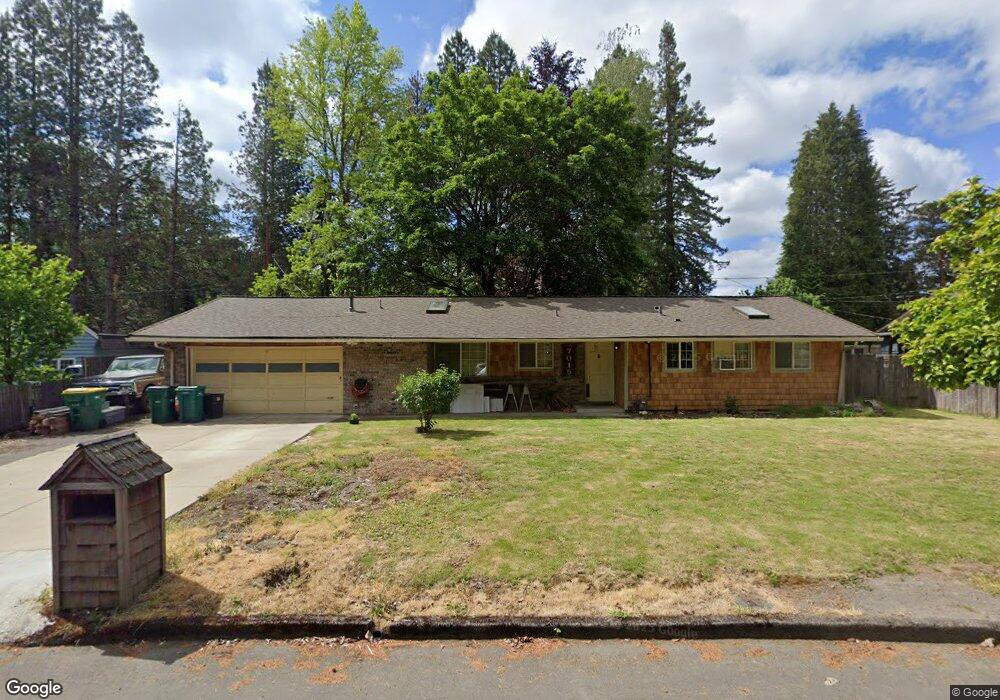
7015 SW Merry Ln Beaverton, OR 97008
Estimated Value: $488,000 - $569,000
3
Beds
2
Baths
1,428
Sq Ft
$379/Sq Ft
Est. Value
About This Home
This home is located at 7015 SW Merry Ln, Beaverton, OR 97008 and is currently estimated at $541,010, approximately $378 per square foot. 7015 SW Merry Ln is a home located in Washington County with nearby schools including McKay Elementary School, Whitford Middle School, and Southridge High School.
Ownership History
Date
Name
Owned For
Owner Type
Purchase Details
Closed on
May 2, 2021
Sold by
Winker Gerrick J
Bought by
Atkinson Kara and Atkinson Jestin
Current Estimated Value
Home Financials for this Owner
Home Financials are based on the most recent Mortgage that was taken out on this home.
Original Mortgage
$380,000
Outstanding Balance
$344,375
Interest Rate
3.1%
Mortgage Type
New Conventional
Estimated Equity
$196,635
Purchase Details
Closed on
Jun 12, 2020
Sold by
Cox Martha Bird
Bought by
Cox Martha Bird and Kuhn Glenn H
Purchase Details
Closed on
Mar 29, 2017
Sold by
Cox Martha Bird
Bought by
Cox Martha Bird and Martha Bird Cox Survivors Trust
Purchase Details
Closed on
Dec 21, 2005
Sold by
Bates Garry and Bates Mary Kaye
Bought by
Winker Gerrick J
Home Financials for this Owner
Home Financials are based on the most recent Mortgage that was taken out on this home.
Original Mortgage
$198,800
Interest Rate
6.35%
Mortgage Type
Fannie Mae Freddie Mac
Create a Home Valuation Report for This Property
The Home Valuation Report is an in-depth analysis detailing your home's value as well as a comparison with similar homes in the area
Home Values in the Area
Average Home Value in this Area
Purchase History
| Date | Buyer | Sale Price | Title Company |
|---|---|---|---|
| Atkinson Kara | $400,000 | First American Title | |
| Cox Martha Bird | -- | None Available | |
| Cox Martha Bird | $170,000 | None Available | |
| Winker Gerrick J | $248,500 | First Amer Title Ins Co Or |
Source: Public Records
Mortgage History
| Date | Status | Borrower | Loan Amount |
|---|---|---|---|
| Open | Atkinson Kara | $380,000 | |
| Previous Owner | Winker Gerrick J | $198,800 |
Source: Public Records
Tax History Compared to Growth
Tax History
| Year | Tax Paid | Tax Assessment Tax Assessment Total Assessment is a certain percentage of the fair market value that is determined by local assessors to be the total taxable value of land and additions on the property. | Land | Improvement |
|---|---|---|---|---|
| 2025 | $4,753 | $258,970 | -- | -- |
| 2024 | $4,465 | $251,430 | -- | -- |
| 2023 | $4,465 | $244,110 | $0 | $0 |
| 2022 | $4,313 | $244,110 | $0 | $0 |
| 2021 | $4,157 | $230,100 | $0 | $0 |
| 2020 | $3,685 | $203,970 | $0 | $0 |
| 2019 | $3,569 | $198,030 | $0 | $0 |
| 2018 | $3,453 | $192,270 | $0 | $0 |
| 2017 | $3,330 | $186,670 | $0 | $0 |
| 2016 | $3,212 | $181,240 | $0 | $0 |
| 2015 | $3,112 | $175,970 | $0 | $0 |
| 2014 | $3,061 | $170,850 | $0 | $0 |
Source: Public Records
Map
Nearby Homes
- 6745 SW Scholls Ferry Rd Unit 10
- 6745 SW Scholls Ferry Rd Unit 38
- 7640 SW Whitford Dr
- 10275 SW Winter Ln
- 6325 SW Elm Ave
- 9845 SW Eagle Ln
- 10440 SW Denney Rd
- 10405 SW Denney Rd Unit 90
- 6455 SW Scholls Ferry Rd
- 6555 SW 86th Ave
- 6075 SW Arrow Wood Ln
- 8475 SW Bohmann Pkwy
- 6025 SW Spruce Ave
- 10080 SW Crystal St
- 8050 SW 103rd Ave
- 5805 SW Arrow Wood Ln
- 10345 SW Homestead Ln
- 8512 SW Brightfield Cir Unit 49
- 7897 SW Skyhar Dr
- 7570 SW 79th Ave
- 7035 SW Merry Ln
- 6995 SW Merry Ln
- 7030 SW Merry Ln
- 7000 SW Merry Ln
- 6975 SW Merry Ln
- 9640 SW Denney Rd
- 7000 SW Scholls Ferry Rd
- 7130 SW Scholls Ferry Rd
- 6955 SW Merry Ln
- 6900 SW Merry Ln
- 6880 SW Merry Ln
- 9685 SW Cynthia St
- 6945 SW Scholls Ferry Rd
- 7085 SW Scholls Ferry Rd
- 7160 SW Scholls Ferry Rd
- 9721 SW Denney Rd
- 9720 SW Denney Rd
- 9705 SW Cynthia St
- 7070 SW Scholls Ferry Rd
- 6935 SW Merry Ln