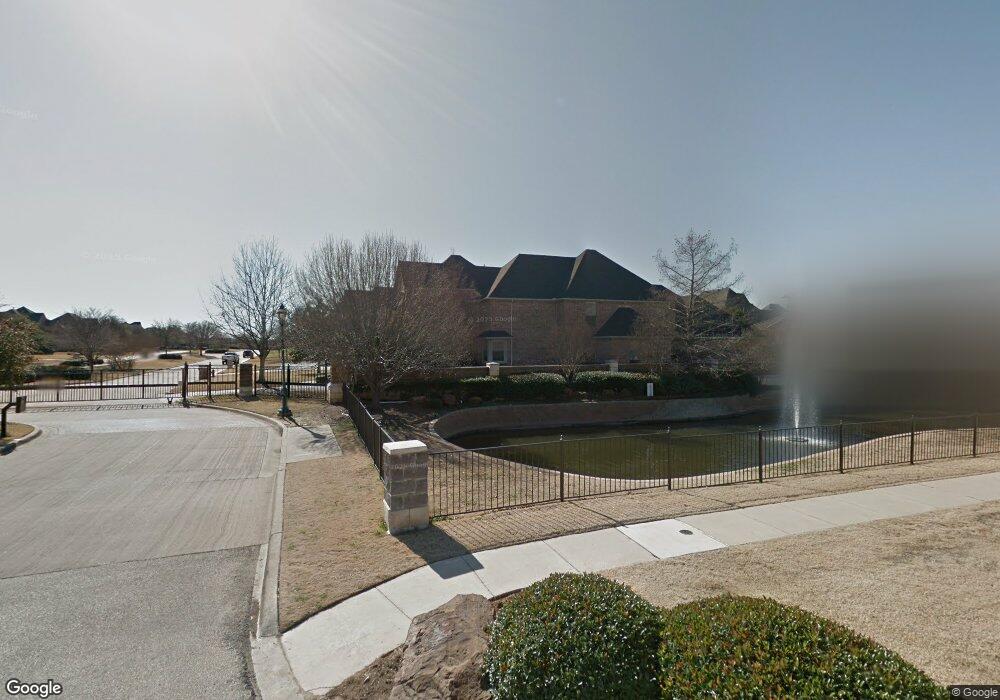
7016 Shalimar Ct Colleyville, TX 76034
Estimated Value: $1,291,000 - $1,345,000
5
Beds
5
Baths
4,947
Sq Ft
$267/Sq Ft
Est. Value
About This Home
This home is located at 7016 Shalimar Ct, Colleyville, TX 76034 and is currently estimated at $1,321,293, approximately $267 per square foot. 7016 Shalimar Ct is a home located in Tarrant County with nearby schools including Colleyville Elementary School, Cross Timbers Middle School, and Grapevine High School.
Ownership History
Date
Name
Owned For
Owner Type
Purchase Details
Closed on
May 1, 2012
Sold by
Poe Jo A
Bought by
Moss Joseph and Moss Tommie Michelle
Current Estimated Value
Home Financials for this Owner
Home Financials are based on the most recent Mortgage that was taken out on this home.
Original Mortgage
$417,000
Outstanding Balance
$291,748
Interest Rate
4.11%
Mortgage Type
New Conventional
Estimated Equity
$1,029,545
Purchase Details
Closed on
Aug 11, 2000
Sold by
Avant Sales Corp
Bought by
Poe Jo A
Home Financials for this Owner
Home Financials are based on the most recent Mortgage that was taken out on this home.
Original Mortgage
$296,000
Interest Rate
7.62%
Purchase Details
Closed on
Feb 11, 2000
Sold by
Centurion American Custom Homes Inc
Bought by
Avant Sales Corp
Home Financials for this Owner
Home Financials are based on the most recent Mortgage that was taken out on this home.
Original Mortgage
$296,000
Interest Rate
8.19%
Create a Home Valuation Report for This Property
The Home Valuation Report is an in-depth analysis detailing your home's value as well as a comparison with similar homes in the area
Home Values in the Area
Average Home Value in this Area
Purchase History
| Date | Buyer | Sale Price | Title Company |
|---|---|---|---|
| Moss Joseph | -- | Lt | |
| Poe Jo A | -- | Safeco Land Title | |
| Avant Sales Corp | -- | Safeco Land Title |
Source: Public Records
Mortgage History
| Date | Status | Borrower | Loan Amount |
|---|---|---|---|
| Open | Moss Joseph | $417,000 | |
| Previous Owner | Poe Jo A | $296,000 | |
| Previous Owner | Avant Sales Corp | $296,000 | |
| Closed | Poe Jo A | $37,000 |
Source: Public Records
Tax History Compared to Growth
Tax History
| Year | Tax Paid | Tax Assessment Tax Assessment Total Assessment is a certain percentage of the fair market value that is determined by local assessors to be the total taxable value of land and additions on the property. | Land | Improvement |
|---|---|---|---|---|
| 2025 | $4,087 | $1,117,746 | $197,500 | $920,246 |
| 2024 | $4,087 | $1,117,746 | $197,500 | $920,246 |
| 2023 | $15,392 | $1,110,177 | $197,500 | $912,677 |
| 2022 | $16,383 | $1,039,864 | $197,500 | $842,364 |
| 2021 | $16,560 | $754,085 | $175,000 | $579,085 |
| 2020 | $16,816 | $756,741 | $175,000 | $581,741 |
| 2019 | $16,650 | $759,398 | $175,000 | $584,398 |
| 2018 | $3,892 | $654,701 | $125,000 | $529,701 |
| 2017 | $15,944 | $674,890 | $125,000 | $549,890 |
| 2016 | $15,236 | $668,879 | $125,000 | $543,879 |
| 2015 | $13,389 | $586,300 | $75,000 | $511,300 |
| 2014 | $13,389 | $586,300 | $75,000 | $511,300 |
Source: Public Records
Map
Nearby Homes
- 7000 Shalimar Ct
- TBD - Lot 3 John Mccain Rd
- TBD - Lot 1 John Mccain Rd
- 7012 Shepherds Glen
- 6805 Shalimar Ct
- 7255 Oak Alley Dr
- 7312 Hix Ct
- 6900 Sir Spencer Ct
- 7200 Belle Meade Dr
- 7106 Belle Meade Dr
- 7322 Calloway Ct
- 7316 Calloway Ct
- 1417 Nottoway Ct
- 1418 Nottoway Ct
- 1406 Nottoway Ct
- 608 Regency Crossing
- 524 Queensbury Turn
- 521 Regency Crossing
- 1315 Hardage Ln
- 1420 Kensington Ct
- 7012 Shalimar Ct
- 7109 Peters Path
- 7008 Shalimar Ct
- 7017 Shalimar Ct
- TBD - Lot 6 John Mccain Rd
- 7013 Shalimar Ct
- 7004 Shalimar Ct
- 1104 John Mccain Rd
- 7101 Peters Path
- 7009 Shalimar Ct
- 1212 John Mccain Rd
- 7109 Cedar Ct
- 1112 John Mccain Rd
- 7104 Peters Path
- 7005 Shalimar Ct
- 7108 Peters Path
- 7013 Peters Path
- 1116 John Mccain Rd
- 7010 Shepherds Glen
- 7001 Shalimar Ct