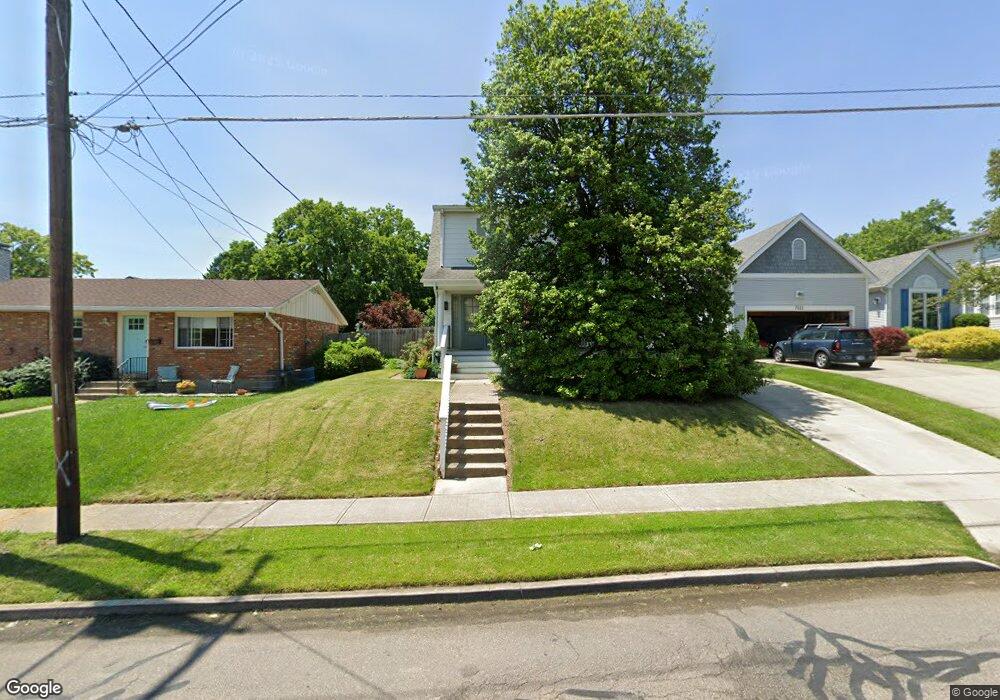
7017 Maple Ave Cincinnati, OH 45243
Estimated Value: $423,000 - $527,000
2
Beds
1
Bath
1,860
Sq Ft
$260/Sq Ft
Est. Value
About This Home
This home is located at 7017 Maple Ave, Cincinnati, OH 45243 and is currently estimated at $483,596, approximately $259 per square foot. 7017 Maple Ave is a home located in Hamilton County with nearby schools including Madeira Elementary School, Madeira Middle School, and Madeira High School.
Ownership History
Date
Name
Owned For
Owner Type
Purchase Details
Closed on
Mar 3, 2023
Sold by
Rebecca W Patterson Trust
Bought by
Goodpastor Andrew and Goodpastor Kayla
Current Estimated Value
Home Financials for this Owner
Home Financials are based on the most recent Mortgage that was taken out on this home.
Original Mortgage
$258,000
Outstanding Balance
$248,724
Interest Rate
6.13%
Mortgage Type
New Conventional
Estimated Equity
$234,872
Purchase Details
Closed on
Apr 12, 2002
Sold by
Rebecca Patterson
Bought by
Patterson Rebecca W and Rebecca W Patterson Trust
Purchase Details
Closed on
Nov 21, 1995
Sold by
Thyberg Paul D
Bought by
Thyberg Jane L
Home Financials for this Owner
Home Financials are based on the most recent Mortgage that was taken out on this home.
Original Mortgage
$30,000
Interest Rate
7.28%
Create a Home Valuation Report for This Property
The Home Valuation Report is an in-depth analysis detailing your home's value as well as a comparison with similar homes in the area
Home Values in the Area
Average Home Value in this Area
Purchase History
| Date | Buyer | Sale Price | Title Company |
|---|---|---|---|
| Goodpastor Andrew | $408,000 | None Listed On Document | |
| Patterson Rebecca W | -- | -- | |
| Thyberg Jane L | -- | -- |
Source: Public Records
Mortgage History
| Date | Status | Borrower | Loan Amount |
|---|---|---|---|
| Open | Goodpastor Andrew | $258,000 | |
| Previous Owner | Thyberg Jane L | $30,000 |
Source: Public Records
Tax History
| Year | Tax Paid | Tax Assessment Tax Assessment Total Assessment is a certain percentage of the fair market value that is determined by local assessors to be the total taxable value of land and additions on the property. | Land | Improvement |
|---|---|---|---|---|
| 2025 | $8,400 | $142,800 | $39,382 | $103,418 |
| 2023 | $7,753 | $142,800 | $39,382 | $103,418 |
| 2022 | $4,058 | $65,913 | $27,570 | $38,343 |
| 2021 | $3,961 | $65,913 | $27,570 | $38,343 |
| 2020 | $3,677 | $65,913 | $27,570 | $38,343 |
| 2019 | $3,490 | $58,850 | $24,616 | $34,234 |
| 2018 | $3,518 | $58,850 | $24,616 | $34,234 |
| 2017 | $3,330 | $58,850 | $24,616 | $34,234 |
| 2016 | $2,856 | $49,354 | $13,412 | $35,942 |
| 2015 | $2,649 | $49,354 | $13,412 | $35,942 |
| 2014 | $2,665 | $49,354 | $13,412 | $35,942 |
| 2013 | $2,488 | $45,280 | $12,306 | $32,974 |
Source: Public Records
Map
Nearby Homes
- 7024 Fowler Ave
- 7156 Maple Ave
- 7317 Euclid Ave
- 7389 Southside Ave
- 7474 Dawson Rd
- 7220 Mar Del Dr
- 7406 Dawson Rd
- 7151 Euclid Ave
- 7834 Laurel Ave
- 7159 Hosbrook Rd
- 7831 Euclid Ave
- 7845 Euclid Ave
- 7503 S Timberlane Dr
- 7231 Berwood Dr
- 7321 Hosbrook Rd
- 6604 Madeira Hills Dr
- 6752 Rose Crest Ave
- 7437 Madeira Pines Dr
- 7124 Sanoma Ave
- 7237 Osceola Dr
- 7021 Maple Ave
- 7013 Maple Ave
- 7025 Maple Ave
- 7009 Maple Ave
- 7016 Wallace Ave
- 7020 Wallace Ave
- 7012 Wallace Ave
- 7005 Maple Ave
- 7029 Maple Ave
- 7024 Wallace Ave
- 7024 Maple Ave Unit 5
- 7008 Wallace Ave
- 7016 Maple Ave Unit 7
- 7016 Maple Ave
- 7012 Maple Ave Unit 8
- 7012 Maple Ave
- 7008 Maple Ave
- 7001 Maple Ave
- 7020 Maple Ave Unit 6
- 7020 Maple Ave
Your Personal Tour Guide
Ask me questions while you tour the home.