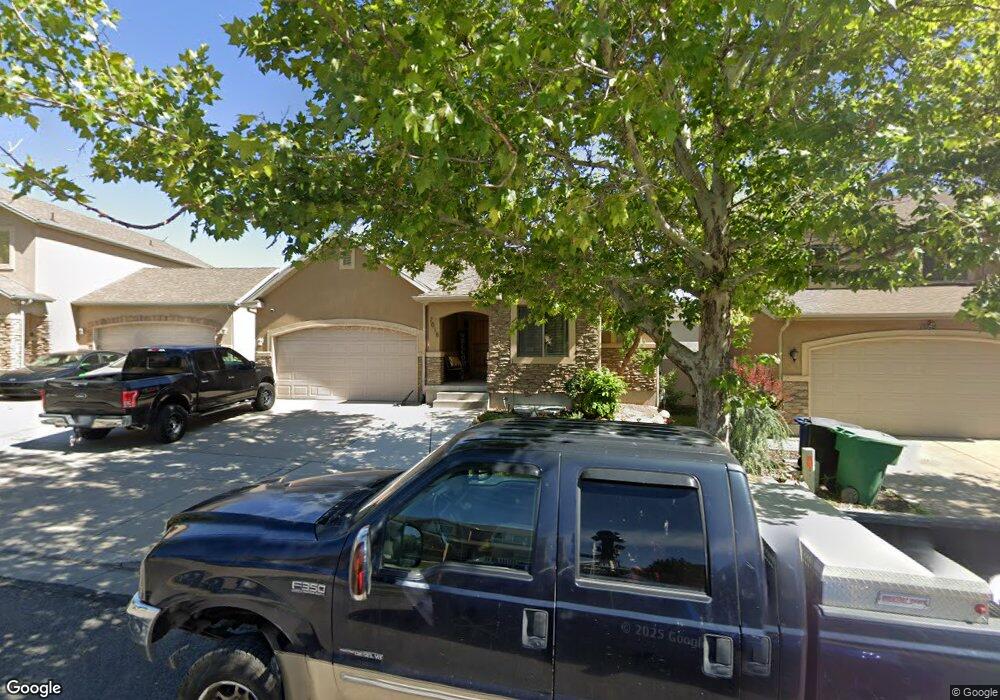
7018 Dry Sycamore Ln West Jordan, UT 84081
Jordan Hills NeighborhoodEstimated Value: $549,000 - $576,000
4
Beds
2
Baths
1,436
Sq Ft
$391/Sq Ft
Est. Value
About This Home
This home is located at 7018 Dry Sycamore Ln, West Jordan, UT 84081 and is currently estimated at $561,519, approximately $391 per square foot. 7018 Dry Sycamore Ln is a home located in Salt Lake County with nearby schools including Sunset Ridge Middle School, Copper Hills High School, and Ascent Academies of Utah West Jordan.
Ownership History
Date
Name
Owned For
Owner Type
Purchase Details
Closed on
Jan 9, 2017
Sold by
Branson Travis Blair and Smith Maddison Lindsay
Bought by
Morris James and Morris Jauslyne
Current Estimated Value
Home Financials for this Owner
Home Financials are based on the most recent Mortgage that was taken out on this home.
Original Mortgage
$270,146
Outstanding Balance
$225,000
Interest Rate
4.5%
Mortgage Type
FHA
Estimated Equity
$336,519
Purchase Details
Closed on
May 23, 2013
Sold by
Gardner Simon L and Gardner Kristin D
Bought by
Barnson Travis Blair and Smith Maddison Lindsay
Home Financials for this Owner
Home Financials are based on the most recent Mortgage that was taken out on this home.
Original Mortgage
$250,900
Interest Rate
3.41%
Mortgage Type
FHA
Purchase Details
Closed on
Aug 14, 2006
Sold by
Mehta Jeetendra
Bought by
Gardner Simon L and Gardner Kristin D
Home Financials for this Owner
Home Financials are based on the most recent Mortgage that was taken out on this home.
Original Mortgage
$33,600
Interest Rate
6.4%
Mortgage Type
Stand Alone Second
Purchase Details
Closed on
Jun 22, 2006
Sold by
Bristlecone Development Group Lc
Bought by
Mehta Jeetendra
Home Financials for this Owner
Home Financials are based on the most recent Mortgage that was taken out on this home.
Original Mortgage
$33,600
Interest Rate
6.4%
Mortgage Type
Stand Alone Second
Purchase Details
Closed on
May 18, 2006
Sold by
Wu Nien Chien Iris
Bought by
Bristlecone Development Group Llc
Home Financials for this Owner
Home Financials are based on the most recent Mortgage that was taken out on this home.
Original Mortgage
$237,500
Interest Rate
6.55%
Mortgage Type
Fannie Mae Freddie Mac
Purchase Details
Closed on
Jun 28, 2005
Sold by
Self David A
Bought by
Chuang Holmes and Wu Nien Chien Iris
Home Financials for this Owner
Home Financials are based on the most recent Mortgage that was taken out on this home.
Original Mortgage
$204,000
Interest Rate
5.7%
Mortgage Type
Construction
Purchase Details
Closed on
Mar 14, 2005
Sold by
Odyssey Capital Management Llc
Bought by
Self David A
Home Financials for this Owner
Home Financials are based on the most recent Mortgage that was taken out on this home.
Original Mortgage
$1,031,000
Interest Rate
5.61%
Mortgage Type
Construction
Purchase Details
Closed on
Feb 17, 2005
Sold by
Lnc Investments Inc
Bought by
Odyssey Capital Management Llc
Home Financials for this Owner
Home Financials are based on the most recent Mortgage that was taken out on this home.
Original Mortgage
$1,031,000
Interest Rate
5.61%
Mortgage Type
Construction
Create a Home Valuation Report for This Property
The Home Valuation Report is an in-depth analysis detailing your home's value as well as a comparison with similar homes in the area
Home Values in the Area
Average Home Value in this Area
Purchase History
| Date | Buyer | Sale Price | Title Company |
|---|---|---|---|
| Morris James | -- | Highland Title Agency | |
| Barnson Travis Blair | -- | Metro National Title | |
| Gardner Simon L | -- | Integrated Title Ins Service | |
| Mehta Jeetendra | -- | Integrated Title Ins Service | |
| Bristlecone Development Group Llc | -- | Integrated Title Ins Svcs | |
| Chuang Holmes | -- | Integrated Title Ins Svcs | |
| Self David A | -- | Integrated Title Ins Svcs | |
| Odyssey Capital Management Llc | -- | Metro National Title |
Source: Public Records
Mortgage History
| Date | Status | Borrower | Loan Amount |
|---|---|---|---|
| Open | Morris James | $270,146 | |
| Previous Owner | Barnson Travis Blair | $250,900 | |
| Previous Owner | Gardner Simon L | $33,600 | |
| Previous Owner | Gardner Simon L | $204,800 | |
| Previous Owner | Mehta Jeetendra | $237,500 | |
| Previous Owner | Chuang Holmes | $204,000 | |
| Previous Owner | Self David A | $1,031,000 |
Source: Public Records
Tax History Compared to Growth
Tax History
| Year | Tax Paid | Tax Assessment Tax Assessment Total Assessment is a certain percentage of the fair market value that is determined by local assessors to be the total taxable value of land and additions on the property. | Land | Improvement |
|---|---|---|---|---|
| 2025 | $2,804 | $558,000 | $100,600 | $457,400 |
| 2024 | $2,804 | $539,500 | $97,300 | $442,200 |
| 2023 | $2,915 | $528,600 | $95,300 | $433,300 |
| 2022 | $2,992 | $533,700 | $93,500 | $440,200 |
| 2021 | $2,413 | $391,900 | $74,100 | $317,800 |
| 2020 | $2,295 | $349,800 | $74,100 | $275,700 |
| 2019 | $2,255 | $337,000 | $74,100 | $262,900 |
| 2018 | $2,157 | $319,700 | $72,000 | $247,700 |
| 2017 | $2,022 | $298,400 | $72,000 | $226,400 |
| 2016 | $1,910 | $264,800 | $72,000 | $192,800 |
| 2015 | $1,850 | $250,100 | $73,300 | $176,800 |
| 2014 | $1,771 | $235,700 | $69,900 | $165,800 |
Source: Public Records
Map
Nearby Homes
- 7011 W Saw Timber Way
- 7009 W 7895 S
- 7953 S 7110 W
- 7069 W Cottage Point Dr
- Witzel Plan at The Sycamores
- Beatrix Plan at The Sycamores
- Sweetwater Plan at The Sycamores
- Princeton Plan at The Sycamores
- Dakota Plan at The Sycamores
- Dashell Plan at The Sycamores
- Roosevelt Plan at The Sycamores
- Wasatch Plan at The Sycamores
- 7919 S Ares Ct
- 7169 Moorepark Place
- 7182 Moorepark Place Unit 10
- 7051 W Owens View Way
- 7776 S Iron Core Ln
- 7143 W 8130 S
- 6819 Pomona Ct
- 7092 W Jayson Bend Dr
- 7018 W Dry Sycamore Ln
- 7012 W Dry Sycamore Ln
- 7012 Dry Sycamore Ln
- 7026 Dry Sycamore Ln
- 7026 W Dry Sycamore Ln
- 7013 W Saw Timber Way
- 7034 W Dry Sycamore Ln
- 7034 Dry Sycamore Ln
- 7023 W Saw Timber Way
- 7023 W Saw Timber Way Unit Basement
- 7027 W Dry Sycamore Ln
- 7027 Dry Sycamore Ln
- 7017 W Dry Sycamore Ln
- 7017 Dry Sycamore Ln
- 7033 W Saw Timber Way
- 7033 W Saw Timber Way Unit 540
- 7042 Dry Sycamore Ln
- 7042 W Dry Sycamore Ln
- 7957 S Bury Rd
- 7963 S Bury Rd