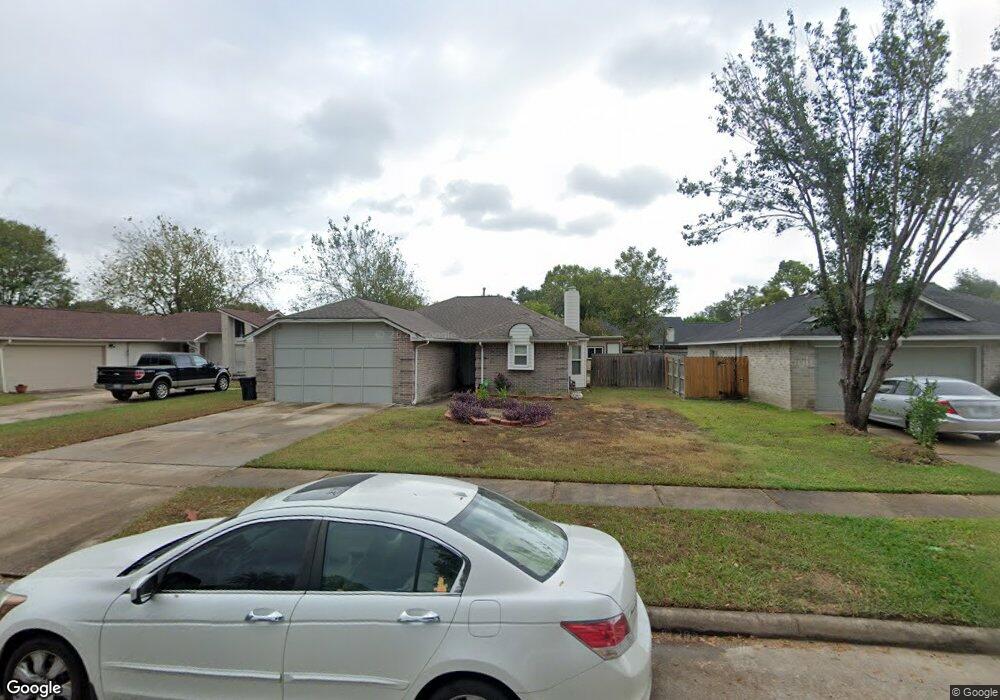
7018 Feather Creek Dr Houston, TX 77086
North Houston NeighborhoodEstimated Value: $202,655 - $249,000
3
Beds
2
Baths
1,350
Sq Ft
$166/Sq Ft
Est. Value
About This Home
This home is located at 7018 Feather Creek Dr, Houston, TX 77086 and is currently estimated at $224,664, approximately $166 per square foot. 7018 Feather Creek Dr is a home located in Harris County with nearby schools including Kujawa EC/Pre-K/K School, Carmichael Elementary School, and Shotwell Middle School.
Ownership History
Date
Name
Owned For
Owner Type
Purchase Details
Closed on
Jun 3, 2015
Sold by
Vanvannguyen Giau Van and Tran Nga Thi
Bought by
Vu Hong Thi and Vu Thanh Hong
Current Estimated Value
Purchase Details
Closed on
Oct 26, 1995
Sold by
Gramling Terry L
Bought by
Vanvannguyen Giau Van and Tran Nga Thi
Home Financials for this Owner
Home Financials are based on the most recent Mortgage that was taken out on this home.
Original Mortgage
$42,400
Interest Rate
7.6%
Purchase Details
Closed on
Mar 25, 1994
Sold by
Coastal Banc Svgs Assn
Bought by
Gramling Terry L
Home Financials for this Owner
Home Financials are based on the most recent Mortgage that was taken out on this home.
Original Mortgage
$36,900
Interest Rate
7.05%
Create a Home Valuation Report for This Property
The Home Valuation Report is an in-depth analysis detailing your home's value as well as a comparison with similar homes in the area
Home Values in the Area
Average Home Value in this Area
Purchase History
| Date | Buyer | Sale Price | Title Company |
|---|---|---|---|
| Vu Hong Thi | -- | None Available | |
| Vanvannguyen Giau Van | -- | Title Agency #40 | |
| Gramling Terry L | -- | Title Agency #40 |
Source: Public Records
Mortgage History
| Date | Status | Borrower | Loan Amount |
|---|---|---|---|
| Previous Owner | Vanvannguyen Giau Van | $42,400 | |
| Previous Owner | Gramling Terry L | $36,900 |
Source: Public Records
Tax History Compared to Growth
Tax History
| Year | Tax Paid | Tax Assessment Tax Assessment Total Assessment is a certain percentage of the fair market value that is determined by local assessors to be the total taxable value of land and additions on the property. | Land | Improvement |
|---|---|---|---|---|
| 2025 | $4,608 | $215,016 | $39,135 | $175,881 |
| 2024 | $4,608 | $199,222 | $39,135 | $160,087 |
| 2023 | $4,608 | $222,029 | $39,135 | $182,894 |
| 2022 | $4,551 | $175,709 | $33,165 | $142,544 |
| 2021 | $3,786 | $155,899 | $33,165 | $122,734 |
| 2020 | $3,828 | $146,290 | $33,165 | $113,125 |
| 2019 | $3,629 | $129,276 | $16,912 | $112,364 |
| 2018 | $1,922 | $133,878 | $16,912 | $116,966 |
| 2017 | $3,395 | $125,440 | $15,187 | $110,253 |
| 2016 | $3,079 | $113,756 | $15,187 | $98,569 |
| 2015 | $2,148 | $107,909 | $15,187 | $92,722 |
| 2014 | $2,148 | $79,255 | $15,187 | $64,068 |
Source: Public Records
Map
Nearby Homes
- 7002 Sandswept Ln
- 7023 Sandswept Ln
- 7218 Winding Trace Dr
- 10614 Mackenzie Dr
- 10307 Bammel North Houston Rd
- 10711 Heather Hill Dr
- 6722 Winding Trace Dr
- 7222 Northleaf Dr
- 6911 Silver Star Dr
- 11007 Tobasa Ct
- 7227 Greenyard Dr
- 10723 Mackenzie Dr
- 6654 Brownie Campbell Rd
- 7302 Seton Lake Dr
- 11006 Crinkleawn Dr
- 6630 Brownie Campbell Rd
- 6822 Dusty Dawn Dr
- 6615 Winding Trace Dr
- 7307 Silver Star Dr
- 6610 Northleaf Dr
- 7014 Feather Creek Dr
- 7102 Feather Creek Dr
- 7019 Winding Trace Dr
- 7015 Winding Trace Dr
- 7010 Feather Creek Dr
- 7106 Feather Creek Dr
- 7023 Winding Trace Dr
- 7011 Winding Trace Dr
- 7019 Feather Creek Dr
- 7103 Feather Creek Dr
- 7015 Feather Creek Dr
- 7103 Winding Trace Dr
- 7006 Feather Creek Dr
- 7110 Feather Creek Dr
- 7007 Winding Trace Dr
- 7107 Feather Creek Dr
- 7011 Feather Creek Dr
- 7107 Winding Trace Dr
- 7002 Feather Creek Dr
- 7007 Feather Creek Dr