Estimated Value: $269,000 - $310,000
3
Beds
2
Baths
1,732
Sq Ft
$168/Sq Ft
Est. Value
About This Home
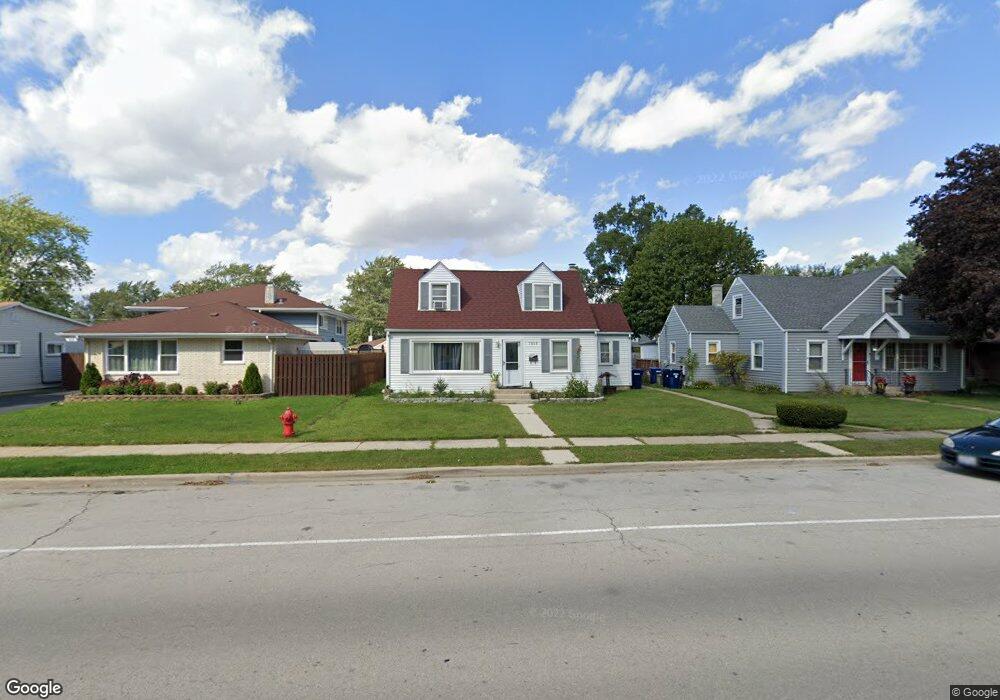
This home is located at 7018 W 115th St, Worth, IL 60482 and is currently estimated at $290,820, approximately $167 per square foot. 7018 W 115th St is a home located in Cook County with nearby schools including Worth Elementary School, Worth Jr High School, and A B Shepard High School.
Ownership History
Date
Name
Owned For
Owner Type
Purchase Details
Closed on
Nov 28, 2016
Sold by
Chacon Abel and Chacon Maria G
Bought by
Chacon Maria G
Current Estimated Value
Home Financials for this Owner
Home Financials are based on the most recent Mortgage that was taken out on this home.
Original Mortgage
$95,500
Outstanding Balance
$43,064
Interest Rate
3.12%
Mortgage Type
New Conventional
Estimated Equity
$247,756
Purchase Details
Closed on
Apr 26, 2004
Sold by
Snyder David K and Snyder Gerilynne M
Bought by
Chacon Abel and Chacon Maria G
Home Financials for this Owner
Home Financials are based on the most recent Mortgage that was taken out on this home.
Original Mortgage
$180,750
Outstanding Balance
$84,236
Interest Rate
5.85%
Mortgage Type
Unknown
Estimated Equity
$206,584
Purchase Details
Closed on
Dec 8, 1993
Sold by
Ficek Mark and Ficek Janice
Bought by
Snyder David K and Snyder Gerilynne M
Home Financials for this Owner
Home Financials are based on the most recent Mortgage that was taken out on this home.
Original Mortgage
$97,850
Interest Rate
6.95%
Create a Home Valuation Report for This Property
The Home Valuation Report is an in-depth analysis detailing your home's value as well as a comparison with similar homes in the area
Home Values in the Area
Average Home Value in this Area
Purchase History
| Date | Buyer | Sale Price | Title Company |
|---|---|---|---|
| Chacon Maria G | -- | Premier Title | |
| Chacon Abel | $181,000 | Pntn | |
| Snyder David K | $68,000 | -- |
Source: Public Records
Mortgage History
| Date | Status | Borrower | Loan Amount |
|---|---|---|---|
| Open | Chacon Maria G | $95,500 | |
| Open | Chacon Abel | $180,750 | |
| Previous Owner | Snyder David K | $97,850 |
Source: Public Records
Tax History
| Year | Tax Paid | Tax Assessment Tax Assessment Total Assessment is a certain percentage of the fair market value that is determined by local assessors to be the total taxable value of land and additions on the property. | Land | Improvement |
|---|---|---|---|---|
| 2025 | $6,690 | $19,722 | $3,510 | $16,212 |
| 2024 | $6,690 | $19,722 | $3,510 | $16,212 |
| 2023 | $5,503 | $22,000 | $3,510 | $18,490 |
| 2022 | $5,503 | $16,465 | $3,071 | $13,394 |
| 2021 | $5,331 | $16,464 | $3,071 | $13,393 |
| 2020 | $5,302 | $16,464 | $3,071 | $13,393 |
| 2019 | $5,403 | $16,304 | $2,778 | $13,526 |
| 2018 | $5,379 | $16,304 | $2,778 | $13,526 |
| 2017 | $5,401 | $16,304 | $2,778 | $13,526 |
| 2016 | $5,217 | $14,156 | $2,340 | $11,816 |
| 2015 | $5,067 | $14,156 | $2,340 | $11,816 |
| 2014 | $4,990 | $14,156 | $2,340 | $11,816 |
| 2013 | $5,090 | $15,747 | $2,340 | $13,407 |
Source: Public Records
Map
Nearby Homes
- 11245 S Harlem Ave Unit A12
- 6732 W 113th Place
- 7340 W 115th St
- 11339 S Normandy Ave
- 7400 W 113th Place
- 11257 S Pacific Dr
- 6601 W 115th Place
- 11334 S Nashville Ave
- 11326 S Nashville Ave
- 11156 S Worth Ave
- 6914 W Crandall Ave Unit 2M
- 11913 S 71st Ct
- 6856 W Crandall Ave
- 7201 W 110th St
- 7307 W College Dr
- 11118 S Natoma Ave
- 7010 W 110th St Unit 6
- 10 Moorings Dr
- 10940 S Worth Ave Unit 1094011
- 7402 W 111th St Unit 111
- 7012 W 115th St
- 7020 W 115th St
- 7006 W 115th St
- 7024 W 115th St
- 7021 W 114th Place
- 7013 W 114th Place
- 7023 W 114th Place
- 7002 W 115th St
- 7036 W 115th St
- 7009 W 114th Place
- 7025 W 114th Place
- 7000 W 115th St
- 7023 W 115th St
- 7023 W 115th St
- 7013 W 115th St
- 7013 W 115th St
- 7042 W 115th St
- 7003 W 114th Place
- 7031 W 114th Place
- 7035 W 115th St