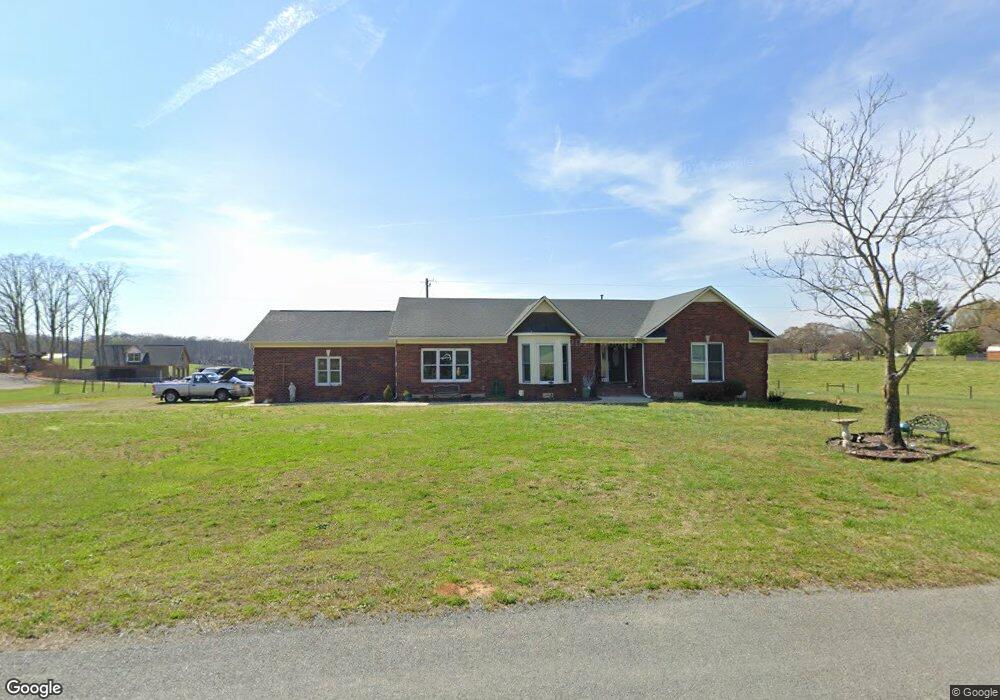
7019 Alexander Farm Rd Monroe, NC 28110
Estimated Value: $412,000 - $619,000
3
Beds
3
Baths
2,188
Sq Ft
$222/Sq Ft
Est. Value
About This Home
This home is located at 7019 Alexander Farm Rd, Monroe, NC 28110 and is currently estimated at $485,302, approximately $221 per square foot. 7019 Alexander Farm Rd is a home located in Union County with nearby schools including New Salem Elementary School, Piedmont Middle School, and Piedmont High School.
Ownership History
Date
Name
Owned For
Owner Type
Purchase Details
Closed on
Sep 10, 2019
Sold by
Walton Michael Ray and Walton Jackie
Bought by
Mcgee Michael R and Mcgee Diane
Current Estimated Value
Purchase Details
Closed on
May 9, 2019
Sold by
Mcgee Michael R and Mcgee Diane
Bought by
Walton Michael Ray
Purchase Details
Closed on
Feb 1, 2016
Sold by
Walton Donald Ray and Walton Shirley
Bought by
Mcgee Michael R and Mcgee Dianne
Purchase Details
Closed on
Sep 30, 2014
Sold by
Walton Donald Ray and Walton Shirley
Bought by
Walton Donald Ray and Walton Shirley
Purchase Details
Closed on
Jul 7, 2014
Sold by
Talbot Jeffrey and Talbot Amy
Bought by
Walton Donald Ray and Walton Shirley S
Purchase Details
Closed on
Aug 12, 1997
Sold by
Heron Joann Adaith
Bought by
Talbot Jeffrey and Wife Amy Talbot
Create a Home Valuation Report for This Property
The Home Valuation Report is an in-depth analysis detailing your home's value as well as a comparison with similar homes in the area
Home Values in the Area
Average Home Value in this Area
Purchase History
| Date | Buyer | Sale Price | Title Company |
|---|---|---|---|
| Mcgee Michael R | -- | None Available | |
| Walton Michael Ray | $220,000 | None Available | |
| Mcgee Michael R | $210,000 | None Available | |
| Walton Donald Ray | -- | Chicago Title Insurance Co | |
| Walton Donald Ray | $160,000 | Chicago Title Insurance Co | |
| Talbot Jeffrey | $126,000 | -- |
Source: Public Records
Tax History Compared to Growth
Tax History
| Year | Tax Paid | Tax Assessment Tax Assessment Total Assessment is a certain percentage of the fair market value that is determined by local assessors to be the total taxable value of land and additions on the property. | Land | Improvement |
|---|---|---|---|---|
| 2024 | $1,913 | $295,700 | $23,600 | $272,100 |
| 2023 | $1,852 | $295,700 | $23,600 | $272,100 |
| 2022 | $1,852 | $295,700 | $23,600 | $272,100 |
| 2021 | $1,856 | $295,700 | $23,600 | $272,100 |
| 2020 | $1,556 | $197,450 | $15,150 | $182,300 |
| 2019 | $1,544 | $197,450 | $15,150 | $182,300 |
| 2018 | $1,511 | $192,950 | $15,150 | $177,800 |
| 2017 | $1,607 | $193,000 | $15,200 | $177,800 |
| 2016 | $1,556 | $191,410 | $13,610 | $177,800 |
| 2015 | $1,534 | $191,410 | $13,610 | $177,800 |
| 2014 | $1,385 | $196,000 | $29,550 | $166,450 |
Source: Public Records
Map
Nearby Homes
- 7218 Alexander Farm Rd
- 3436 Greene Rd
- 5612 Love Mill Rd Unit 1
- 3428 Greene Rd
- 5409 Love Mill Rd
- 6615 Love Mill Rd
- 9326 Old Ferry Rd
- 2212 Biggers Cemetery Rd
- 1018 Heath Helms Rd
- 1022 Heath Helms Rd
- 1012 Heath Helms Rd
- 1038 Heath Helms Rd
- 1006 Heath Helms Rd
- 1026 Heath Helms Rd
- 1030 Heath Helms Rd
- 6746 Edwards Farm Ln
- Tract B Rock Hole Rd
- Tract A Rock Hole Rd
- 6812 Sugar and Wine Rd
- 3400 Baucom Manor Rd
- 7021 Alexander Farm Rd
- 7105 Alexander Farm Rd
- 7009 Alexander Farm Rd
- 7010 Alexander Farm Rd
- 7113 Alexander Farm Rd
- 7109 Alexander Farm Rd
- 7117 Alexander Farm Rd
- 7111 Alexander Farm Rd
- 7003 Alexander Farm Rd
- 7039 Alexander Farm Rd
- 7119 Alexander Farm Rd
- 7118 Alexander Farm Rd
- 7107 Alexander Farm Rd
- 7123 Alexander Farm Rd
- 7131 Alexander Farm Rd
- 7141 Alexander Farm Rd
- 7008 Alexander Farm Rd
- 7201 Alexander Farm Rd
- 6913 Alexander Farm Rd
- 6909 Alexander Farm Rd