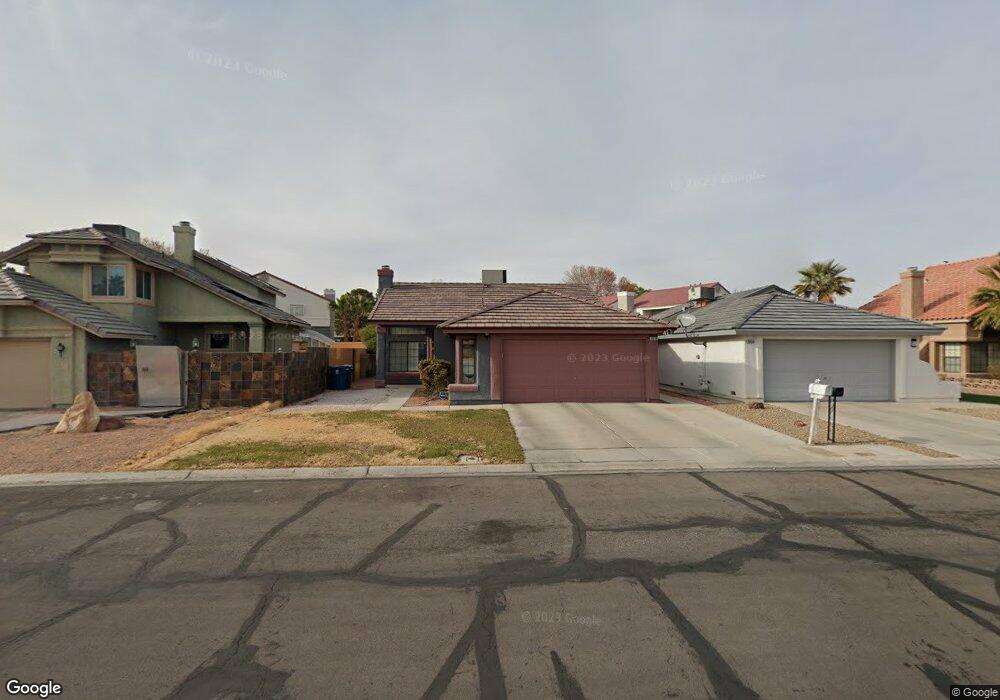
7019 Encore Way Las Vegas, NV 89119
Paradise Valley NeighborhoodEstimated Value: $370,033 - $422,000
2
Beds
2
Baths
1,238
Sq Ft
$316/Sq Ft
Est. Value
About This Home
This home is located at 7019 Encore Way, Las Vegas, NV 89119 and is currently estimated at $391,008, approximately $315 per square foot. 7019 Encore Way is a home located in Clark County with nearby schools including Charlotte Hill Elementary School, Louis Wiener Jr Elementary School, and Jack Lund Schofield Middle School.
Ownership History
Date
Name
Owned For
Owner Type
Purchase Details
Closed on
Sep 11, 2000
Sold by
Ks Nevada Inc
Bought by
Rosales Victor M and Rosales Felipa
Current Estimated Value
Home Financials for this Owner
Home Financials are based on the most recent Mortgage that was taken out on this home.
Original Mortgage
$133,794
Outstanding Balance
$48,798
Interest Rate
8.11%
Mortgage Type
FHA
Estimated Equity
$342,210
Purchase Details
Closed on
Jul 7, 2000
Sold by
Dunagan Timothy M and Dunaggan Kerri J
Bought by
Ks Nevada Inc
Home Financials for this Owner
Home Financials are based on the most recent Mortgage that was taken out on this home.
Original Mortgage
$88,000
Interest Rate
8.55%
Purchase Details
Closed on
Jul 24, 1996
Sold by
Dunagan Timothy M
Bought by
Dunagan Kerri J
Home Financials for this Owner
Home Financials are based on the most recent Mortgage that was taken out on this home.
Original Mortgage
$25,300
Interest Rate
8.32%
Create a Home Valuation Report for This Property
The Home Valuation Report is an in-depth analysis detailing your home's value as well as a comparison with similar homes in the area
Home Values in the Area
Average Home Value in this Area
Purchase History
| Date | Buyer | Sale Price | Title Company |
|---|---|---|---|
| Rosales Victor M | $134,900 | Fidelity National Title | |
| Ks Nevada Inc | $97,800 | National Title Company | |
| Dunagan Kerri J | -- | Lawyers Title |
Source: Public Records
Mortgage History
| Date | Status | Borrower | Loan Amount |
|---|---|---|---|
| Open | Rosales Victor M | $133,794 | |
| Previous Owner | Ks Nevada Inc | $88,000 | |
| Previous Owner | Dunagan Kerri J | $25,300 |
Source: Public Records
Tax History Compared to Growth
Tax History
| Year | Tax Paid | Tax Assessment Tax Assessment Total Assessment is a certain percentage of the fair market value that is determined by local assessors to be the total taxable value of land and additions on the property. | Land | Improvement |
|---|---|---|---|---|
| 2025 | $1,572 | $75,709 | $32,900 | $42,809 |
| 2024 | $1,456 | $75,709 | $32,900 | $42,809 |
| 2023 | $1,456 | $70,764 | $29,750 | $41,014 |
| 2022 | $1,348 | $59,621 | $21,805 | $37,816 |
| 2021 | $1,249 | $57,862 | $21,700 | $36,162 |
| 2020 | $1,157 | $57,778 | $21,700 | $36,078 |
| 2019 | $1,084 | $54,673 | $18,900 | $35,773 |
| 2018 | $1,034 | $50,122 | $15,400 | $34,722 |
| 2017 | $1,428 | $48,691 | $13,300 | $35,391 |
| 2016 | $969 | $46,258 | $10,500 | $35,758 |
| 2015 | $966 | $38,926 | $7,000 | $31,926 |
| 2014 | $938 | $31,030 | $7,000 | $24,030 |
Source: Public Records
Map
Nearby Homes
- 6881 Tamarus St Unit 202
- 7126 Sawtooth Dr
- 1138 Placerville St
- 7135 Sawtooth Dr Unit 2
- 6873 Tamarus St Unit 203
- 6865 Tamarus St Unit 202
- 1466 Finale Ln
- 1508 White Dr
- 6913 Jasmine Creek Way
- 1252 Little Sidnee Dr
- 1233 Little Sidnee Dr
- 7192 Cypress Gardens Ln
- 7384 Emerald Glow St
- 1653 Crystal Shadows Cir
- 7374 Valhalla Ln
- 1602 Tulita Dr
- 7166 Nordic Lights Dr
- 7393 Puritan Ave
- 7164 Paradise Bay Dr
- 2035 E Warm Springs Rd Unit 1019
- 7015 Encore Way
- 7023 Encore Way
- 7011 Encore Way
- 7027 Encore Way
- 7009 Encore Way
- 7029 Encore Way
- 7018 Encore Way
- 7022 Encore Way
- 7014 Encore Way
- 7010 Encore Way
- 7026 Encore Way
- 7005 Encore Way
- 7031 Encore Way
- 7031 Encore Way
- 7031 Encore Way
- 7006 Encore Way
- 7028 Encore Way Unit 5
- 6999 Encore Way
- 7002 Encore Way
- 7033 Encore Way