701C 3rd Ave S North Myrtle Beach, SC 29582
Ocean Drive NeighborhoodEstimated Value: $268,000 - $353,000
2
Beds
2
Baths
914
Sq Ft
$341/Sq Ft
Est. Value
About This Home
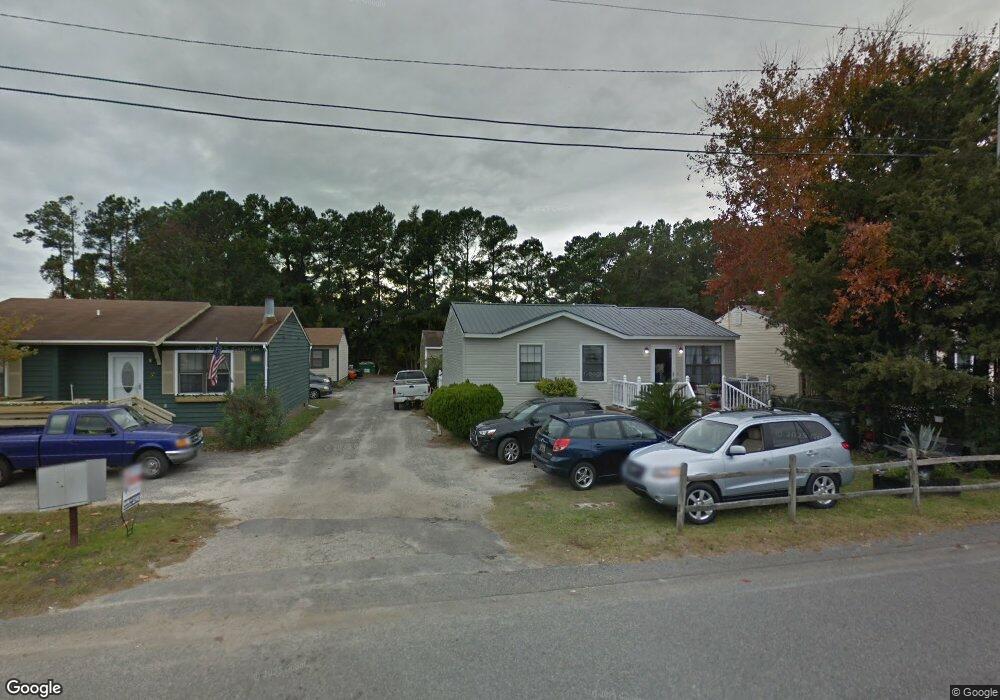
This home is located at 701C 3rd Ave S, North Myrtle Beach, SC 29582 and is currently estimated at $311,667, approximately $340 per square foot. 701C 3rd Ave S is a home located in Horry County with nearby schools including Ocean Drive Elementary School, North Myrtle Beach Middle School, and North Myrtle Beach High School.
Ownership History
Date
Name
Owned For
Owner Type
Purchase Details
Closed on
Jun 3, 2013
Sold by
Stillwell Randy L
Bought by
Bowman Larry Eugene
Current Estimated Value
Purchase Details
Closed on
Mar 19, 2004
Sold by
Lehoux Steven J
Bought by
Stillwell Randy L and Stillwell Helen N
Home Financials for this Owner
Home Financials are based on the most recent Mortgage that was taken out on this home.
Original Mortgage
$83,600
Interest Rate
5.53%
Mortgage Type
Purchase Money Mortgage
Purchase Details
Closed on
Aug 29, 2003
Sold by
Lehoux Cynthia S
Bought by
Lehoux Steven J
Purchase Details
Closed on
Sep 11, 1998
Sold by
Caballero Robert O
Bought by
Lehoux Steven J and Lehoux Cynthia S
Create a Home Valuation Report for This Property
The Home Valuation Report is an in-depth analysis detailing your home's value as well as a comparison with similar homes in the area
Home Values in the Area
Average Home Value in this Area
Purchase History
| Date | Buyer | Sale Price | Title Company |
|---|---|---|---|
| Bowman Larry Eugene | $125,000 | -- | |
| Stillwell Randy L | $88,000 | -- | |
| Lehoux Steven J | -- | -- | |
| Lehoux Steven J | $67,500 | -- |
Source: Public Records
Mortgage History
| Date | Status | Borrower | Loan Amount |
|---|---|---|---|
| Previous Owner | Stillwell Randy L | $83,600 |
Source: Public Records
Tax History Compared to Growth
Tax History
| Year | Tax Paid | Tax Assessment Tax Assessment Total Assessment is a certain percentage of the fair market value that is determined by local assessors to be the total taxable value of land and additions on the property. | Land | Improvement |
|---|---|---|---|---|
| 2024 | $1,883 | $19,304 | $14,400 | $4,904 |
| 2023 | $1,883 | $7,573 | $4,075 | $3,498 |
| 2021 | $1,713 | $7,573 | $4,075 | $3,498 |
| 2020 | $1,694 | $7,573 | $4,075 | $3,498 |
| 2019 | $1,634 | $7,573 | $4,075 | $3,498 |
| 2018 | $0 | $7,256 | $3,350 | $3,906 |
| 2017 | $1,647 | $7,256 | $3,350 | $3,906 |
| 2016 | -- | $7,256 | $3,350 | $3,906 |
| 2015 | $1,632 | $7,257 | $3,351 | $3,906 |
| 2014 | $1,277 | $6,110 | $2,792 | $3,318 |
Source: Public Records
Map
Nearby Homes
- 703 3rd Ave S
- 613 2nd Ave S Unit 21D
- 618 3rd Ave S Unit 4B
- 609B 3rd Ave S
- 618 5th Ave S
- 611 2nd Ave S Unit 16 E
- 611 2nd Ave S Unit 18-C
- 707 1st Ave S Unit 36A
- 528 5th Ave S
- 512 2nd Ave S
- 522 6th Ave S
- 606 7th Ave S Unit F
- 508 5th Ave S
- 94 Cedar Ave
- 611 Surfsong Way Unit B6-3
- 620 Wave Rider Ln Unit B10-1
- 753 Shell Creek Cir Unit B19-2
- 739 Shell Creek Cir Unit 739
- 745 Shell Creek Cir Unit 745
- 100 Ye Olde Kings Hwy Unit E
- 709C 3rd Ave S
- 703C 3rd Ave S
- 703A 3rd Ave S
- 717 3rd Ave S
- 705A 3rd Ave S
- 703B 3rd Ave S
- 707B 3rd Ave S
- 707A 3rd Ave S
- 619 3rd Ave S
- 619A 3rd Ave S Unit 2959
- 619B 3rd Ave S
- 709B 3rd Ave S Unit Ocean Drive
- 709B 3rd Ave S
- 614 3rd Ave S Unit 7-C
- 614 3rd Ave S Unit 7-D Sea Garden
- 614 3rd Ave S Unit OCEAN DRIVE
- 614 3rd Ave S Unit 6-E
- 614 3rd Ave S Unit 6-E Sea Garden
- 614 3rd Ave S
- 614 3rd Ave S Unit 7-C