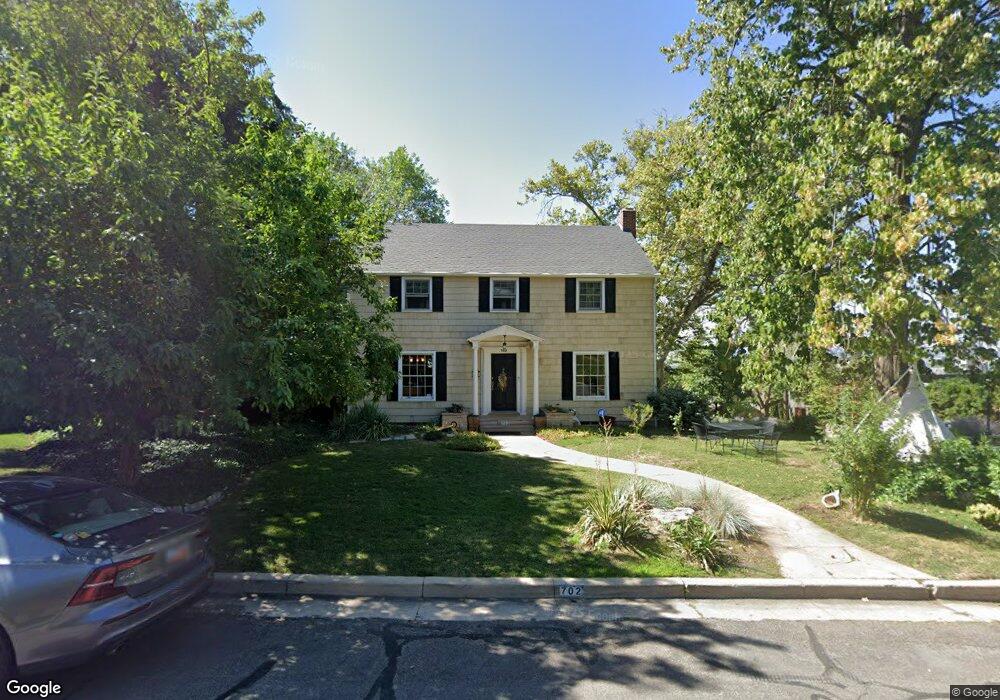
702 10th Ave Salt Lake City, UT 84103
The Avenues NeighborhoodEstimated Value: $930,000 - $1,346,000
4
Beds
3
Baths
2,210
Sq Ft
$496/Sq Ft
Est. Value
About This Home
This home is located at 702 10th Ave, Salt Lake City, UT 84103 and is currently estimated at $1,095,426, approximately $495 per square foot. 702 10th Ave is a home located in Salt Lake County with nearby schools including Ensign School, West High, and Open Classroom.
Ownership History
Date
Name
Owned For
Owner Type
Purchase Details
Closed on
May 19, 2020
Sold by
Defernex Tommaso and Iqbal Ronak
Bought by
Defernex Tommaso and Iqbal Ronak
Current Estimated Value
Home Financials for this Owner
Home Financials are based on the most recent Mortgage that was taken out on this home.
Original Mortgage
$479,000
Outstanding Balance
$335,049
Interest Rate
3.3%
Mortgage Type
New Conventional
Estimated Equity
$760,377
Purchase Details
Closed on
Oct 6, 2015
Sold by
Defernex Tommaso and Iqbal Ronak
Bought by
Defernex Tommaso and Iqbal Ronak
Purchase Details
Closed on
Jun 6, 2012
Sold by
Pitt Richard S and Pitt Gloria G
Bought by
Defernex Tommaso and Iqbal Ronak
Home Financials for this Owner
Home Financials are based on the most recent Mortgage that was taken out on this home.
Original Mortgage
$558,000
Interest Rate
3.84%
Mortgage Type
New Conventional
Purchase Details
Closed on
Oct 26, 2011
Sold by
Pitt Gloria G
Bought by
Pitt Richard S and Pitt Gloria G
Home Financials for this Owner
Home Financials are based on the most recent Mortgage that was taken out on this home.
Original Mortgage
$438,000
Interest Rate
4.01%
Mortgage Type
New Conventional
Purchase Details
Closed on
May 28, 2002
Sold by
Pitt Gloria G and Pitt Richard S
Bought by
Pitt Richard S and Pitt Gloria G
Home Financials for this Owner
Home Financials are based on the most recent Mortgage that was taken out on this home.
Original Mortgage
$235,550
Interest Rate
6.89%
Purchase Details
Closed on
Nov 22, 2000
Sold by
Pitt Richard and Pitt Gloria
Bought by
Pitt Richard S and Pitt Gloria G
Home Financials for this Owner
Home Financials are based on the most recent Mortgage that was taken out on this home.
Original Mortgage
$180,000
Interest Rate
7.5%
Purchase Details
Closed on
Mar 27, 1995
Sold by
Middleton Anthony W and Middleton George W
Bought by
Walgren Kent L and Copier Hanne A
Home Financials for this Owner
Home Financials are based on the most recent Mortgage that was taken out on this home.
Original Mortgage
$184,000
Interest Rate
8.9%
Create a Home Valuation Report for This Property
The Home Valuation Report is an in-depth analysis detailing your home's value as well as a comparison with similar homes in the area
Home Values in the Area
Average Home Value in this Area
Purchase History
| Date | Buyer | Sale Price | Title Company |
|---|---|---|---|
| Defernex Tommaso | -- | Silver Leaf Title Ins Agcy | |
| Defernex Tommaso | -- | Silver Leaf Title Ins Agcy | |
| Defernex Tommaso | -- | None Available | |
| Defernex Tommaso | -- | United Title Services | |
| Pitt Richard S | -- | Advanced Title Slc | |
| Pitt Gloria G | -- | Advanced Title Slc | |
| Pitt Richard S | -- | Title West | |
| Pitt Richard S | -- | Title West | |
| Walgren Kent L | -- | -- |
Source: Public Records
Mortgage History
| Date | Status | Borrower | Loan Amount |
|---|---|---|---|
| Open | Defernex Tommaso | $479,000 | |
| Closed | Defernex Tommaso | $558,000 | |
| Previous Owner | Pitt Gloria G | $438,000 | |
| Previous Owner | Pitt Richard S | $235,550 | |
| Previous Owner | Pitt Richard S | $180,000 | |
| Previous Owner | Walgren Kent L | $184,000 |
Source: Public Records
Tax History Compared to Growth
Tax History
| Year | Tax Paid | Tax Assessment Tax Assessment Total Assessment is a certain percentage of the fair market value that is determined by local assessors to be the total taxable value of land and additions on the property. | Land | Improvement |
|---|---|---|---|---|
| 2025 | $5,019 | $1,030,400 | $254,000 | $776,400 |
| 2024 | $5,019 | $957,600 | $242,400 | $715,200 |
| 2023 | $5,019 | $931,600 | $233,100 | $698,500 |
| 2022 | $5,640 | $973,200 | $188,400 | $784,800 |
| 2021 | $5,049 | $788,800 | $153,100 | $635,700 |
| 2020 | $5,011 | $745,100 | $143,100 | $602,000 |
| 2019 | $5,200 | $727,500 | $133,600 | $593,900 |
| 2018 | $5,000 | $681,200 | $133,600 | $547,600 |
| 2017 | $5,205 | $664,400 | $133,600 | $530,800 |
| 2016 | $5,198 | $630,000 | $128,000 | $502,000 |
| 2015 | $5,670 | $651,400 | $123,900 | $527,500 |
| 2014 | $5,567 | $634,400 | $123,900 | $510,500 |
Source: Public Records
Map
Nearby Homes