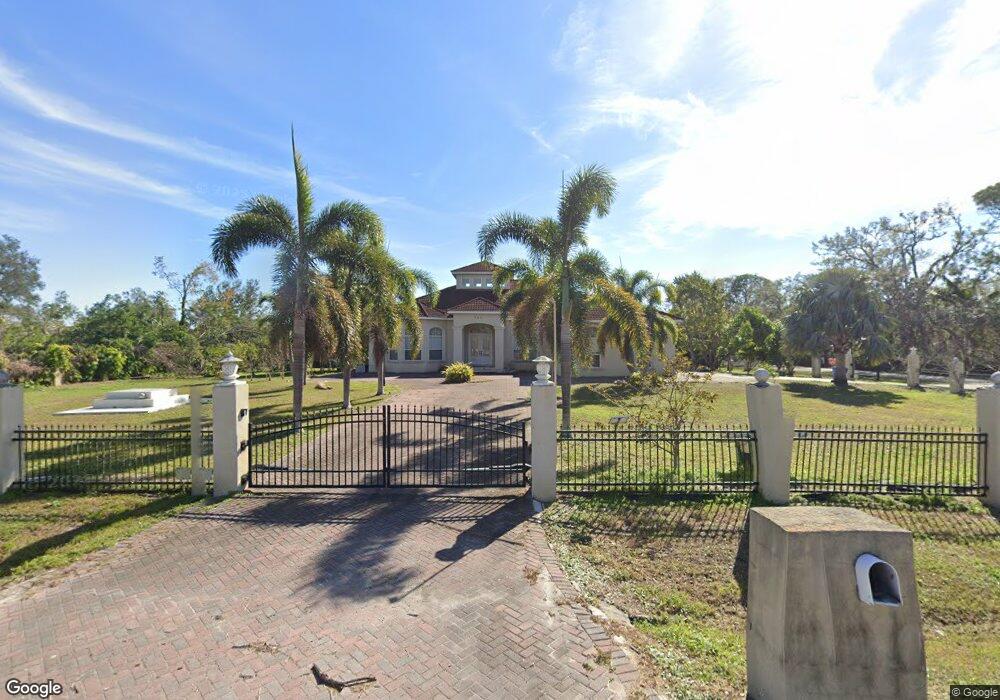
702 10th St SW Ruskin, FL 33570
Estimated Value: $602,000 - $776,000
3
Beds
3
Baths
3,351
Sq Ft
$202/Sq Ft
Est. Value
About This Home
This home is located at 702 10th St SW, Ruskin, FL 33570 and is currently estimated at $676,984, approximately $202 per square foot. 702 10th St SW is a home located in Hillsborough County with nearby schools including Ruskin Elementary School, Shields Middle School, and Lennard High School.
Ownership History
Date
Name
Owned For
Owner Type
Purchase Details
Closed on
Jan 14, 2017
Sold by
Vanvanhua Sang Van and Trong Dawn
Bought by
Thanh Chi and Thanh Bac Tu
Current Estimated Value
Purchase Details
Closed on
Jan 20, 2009
Sold by
Phan Lananh Thi
Bought by
Vanhua Sang and Truong Dawn
Purchase Details
Closed on
Dec 7, 2007
Sold by
Black Stephen W
Bought by
Phan Lananh Thi
Home Financials for this Owner
Home Financials are based on the most recent Mortgage that was taken out on this home.
Original Mortgage
$220,000
Interest Rate
6.22%
Mortgage Type
New Conventional
Purchase Details
Closed on
Aug 7, 2003
Sold by
Crowder James Ray and Crowder Brenda G
Bought by
Black Stephen W and Phan Lananh Thi
Purchase Details
Closed on
Jul 5, 2000
Sold by
Crowder Jamill L and Crowder Heath A
Bought by
Crowder James R and Crowder Brenda G
Purchase Details
Closed on
Nov 21, 1998
Sold by
Lamell Ronald R and Lamell G
Bought by
Kucej Sandra R
Create a Home Valuation Report for This Property
The Home Valuation Report is an in-depth analysis detailing your home's value as well as a comparison with similar homes in the area
Home Values in the Area
Average Home Value in this Area
Purchase History
| Date | Buyer | Sale Price | Title Company |
|---|---|---|---|
| Thanh Chi | $342,400 | Sunbelt Title Agency | |
| Vanhua Sang | $300,000 | Affiliated Title Of Tampa Ba | |
| Phan Lananh Thi | -- | Fairview Title Company | |
| Black Stephen W | $30,000 | South Bay Title Insurance Ag | |
| Crowder James R | -- | -- | |
| Kucej Sandra R | $9,100 | -- |
Source: Public Records
Mortgage History
| Date | Status | Borrower | Loan Amount |
|---|---|---|---|
| Previous Owner | Phan Lananh Thi | $220,000 |
Source: Public Records
Tax History Compared to Growth
Tax History
| Year | Tax Paid | Tax Assessment Tax Assessment Total Assessment is a certain percentage of the fair market value that is determined by local assessors to be the total taxable value of land and additions on the property. | Land | Improvement |
|---|---|---|---|---|
| 2024 | $7,956 | $465,943 | -- | -- |
| 2023 | $7,702 | $452,372 | $0 | $0 |
| 2022 | $7,428 | $439,196 | $0 | $0 |
| 2021 | $7,355 | $426,404 | $59,509 | $366,895 |
| 2020 | $7,620 | $399,849 | $56,675 | $343,174 |
| 2019 | $7,342 | $388,786 | $56,675 | $332,111 |
| 2018 | $6,691 | $346,409 | $0 | $0 |
| 2017 | $5,666 | $335,235 | $0 | $0 |
| 2016 | $5,001 | $238,634 | $0 | $0 |
| 2015 | $4,475 | $216,940 | $0 | $0 |
| 2014 | $4,328 | $208,895 | $0 | $0 |
| 2013 | -- | $216,112 | $0 | $0 |
Source: Public Records
Map
Nearby Homes
- 901 8th Ave SW
- 602 10th St SW
- 912 8th Ave SW
- 604 8th St SW
- 905 10th St SW
- 404 12th St SW
- 901 8th St SW
- 402 8th St SW
- 301 Carlyle Blvd
- 0 11th St SW Unit MFRTB8366394
- 701 Madison St SW
- 805 Leisey Cir
- 803 Leisey Cir
- 105 12th St SW
- 609 4th Ave SW
- 828 Blue Heron Blvd
- 820 Blue Heron Blvd
- 0 Sable Cove Unit MFRTB8439435
- 829 Blue Heron Blvd
- 606 Dickman Dr SW
- 909 8th Ave SW
- 911 8th Ave SW
- 905 8th Ave SW
- 919 W College Ave
- 706 Ornelda St SW
- 705 10th St SW
- 915 College Ave W
- 1001 W College Ave
- 801 10th St SW
- 703 Ornelda St SW
- 607 10th St SW
- 910 8th Ave SW
- 707 Ornelda St SW
- 610 11th St SW
- 803 10th St SW
- 718 Ornelda St SW
- 906 8th Ave SW
- 709 Ornelda St SW
- 606 11th St SW