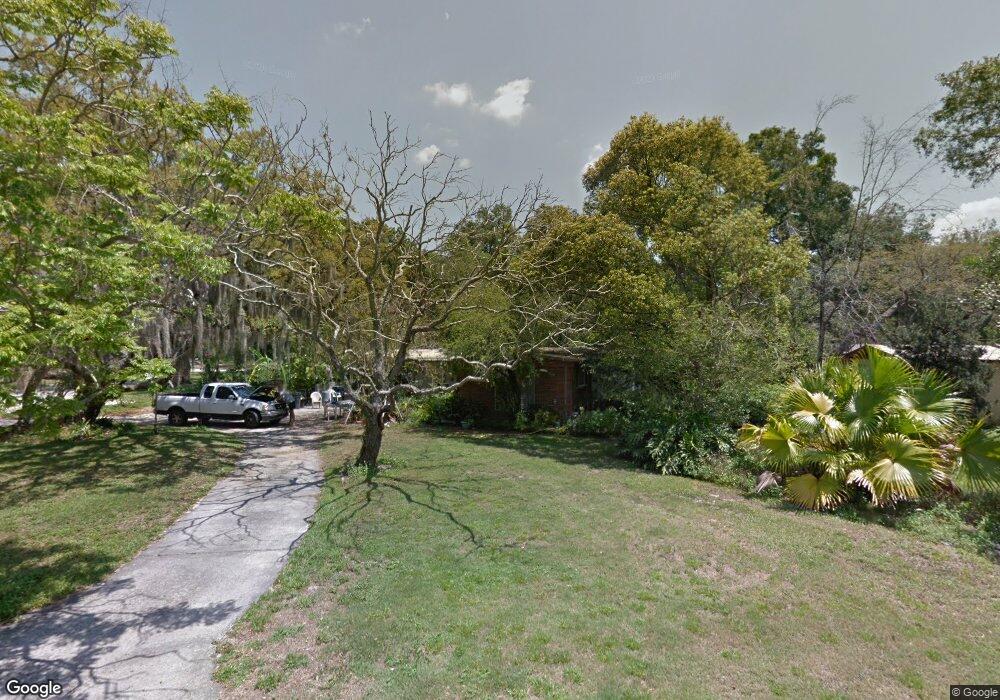
702 Aberdeen Cir Temple Terrace, FL 33617
Estimated Value: $308,000 - $370,000
3
Beds
2
Baths
1,279
Sq Ft
$262/Sq Ft
Est. Value
About This Home
This home is located at 702 Aberdeen Cir, Temple Terrace, FL 33617 and is currently estimated at $334,995, approximately $261 per square foot. 702 Aberdeen Cir is a home located in Hillsborough County with nearby schools including Temple Terrace Elementary School, Greco Middle School, and King High School.
Ownership History
Date
Name
Owned For
Owner Type
Purchase Details
Closed on
Nov 10, 2020
Sold by
Tah 2016-1 Borrower Llc
Bought by
Tricon Sfr 2020-2 Borrower Llc
Current Estimated Value
Purchase Details
Closed on
Oct 1, 2016
Bought by
Tah 2016-1 Borrower Llc
Purchase Details
Closed on
Oct 6, 2014
Sold by
Pennymac Holdings Llc
Bought by
Sfrh Tampa Holdings Lp
Purchase Details
Closed on
Aug 28, 2014
Sold by
Wright Debra M
Bought by
Pennymac Mortgage Investment Trust Holdi
Purchase Details
Closed on
Dec 22, 1994
Sold by
Fox Randi Brown and Fox James Andrew
Bought by
Wright Debra M and Wright Thomas L
Home Financials for this Owner
Home Financials are based on the most recent Mortgage that was taken out on this home.
Original Mortgage
$78,150
Interest Rate
9.23%
Create a Home Valuation Report for This Property
The Home Valuation Report is an in-depth analysis detailing your home's value as well as a comparison with similar homes in the area
Home Values in the Area
Average Home Value in this Area
Purchase History
| Date | Buyer | Sale Price | Title Company |
|---|---|---|---|
| Tricon Sfr 2020-2 Borrower Llc | -- | Os National | |
| Tah 2016-1 Borrower Llc | $100 | -- | |
| Sfrh Tampa Holdings Lp | $70,590 | Liberty Title & Escrow Co | |
| Pennymac Mortgage Investment Trust Holdi | $10,100 | None Available | |
| Pennymac Mortgage Investment Trust Holdi | -- | None Available | |
| Wright Debra M | $82,300 | -- |
Source: Public Records
Mortgage History
| Date | Status | Borrower | Loan Amount |
|---|---|---|---|
| Previous Owner | Wright Debra M | $78,150 |
Source: Public Records
Tax History Compared to Growth
Tax History
| Year | Tax Paid | Tax Assessment Tax Assessment Total Assessment is a certain percentage of the fair market value that is determined by local assessors to be the total taxable value of land and additions on the property. | Land | Improvement |
|---|---|---|---|---|
| 2024 | $4,455 | $269,152 | $130,652 | $138,500 |
| 2023 | $4,021 | $233,372 | $97,989 | $135,383 |
| 2022 | $3,775 | $229,631 | $97,989 | $131,642 |
| 2021 | $3,299 | $169,157 | $73,492 | $95,665 |
| 2020 | $3,067 | $156,177 | $65,326 | $90,851 |
| 2019 | $2,964 | $152,773 | $53,078 | $99,695 |
| 2018 | $2,772 | $144,257 | $0 | $0 |
| 2017 | $2,540 | $122,433 | $0 | $0 |
| 2016 | $2,407 | $112,784 | $0 | $0 |
| 2015 | $2,180 | $101,610 | $0 | $0 |
| 2014 | -- | $76,704 | $0 | $0 |
| 2013 | -- | $75,570 | $0 | $0 |
Source: Public Records
Map
Nearby Homes
- 713 Grand Cir
- 607 E River Dr
- 723 Grand Cir
- 510 Broxburn Ave
- 616 Vanderbaker Rd
- 505 Broxburn Ave
- 517 Broxburn Ave
- 509 Falmouth St
- 7425 Terrace River Dr
- 321 Belle View Ave
- 8309 Tupelo Dr
- 0 Harney Rd Unit MFRT3542590
- 5627 Oakland Dr
- 7025 Allview Dr
- 317 Brentwood Dr
- 7106 Lynwood Dr
- 7502 Gadsden Dr
- 7419 Savannah Ln
- 8508 Tupelo Dr
- 307 Fern Cliff Ave
- 704 Aberdeen Cir
- 701 E River Dr
- 701 East River Dr
- 705 East River Dr
- 705 E River Dr
- 707 East River Dr
- 416 Berwick Ave
- 413 Berwick Ave
- 414 Berwick Ave
- 418 Berwick Ave
- 706 Aberdeen Cir
- 705 Aberdeen Cir
- 709 East River Dr
- 412 Berwick Ave
- 411 Berwick Ave
- 708 Aberdeen Cir
- 413 Dunedin Ave
- 707 Aberdeen Cir
- 711 East River Dr
- 711 E River Dr