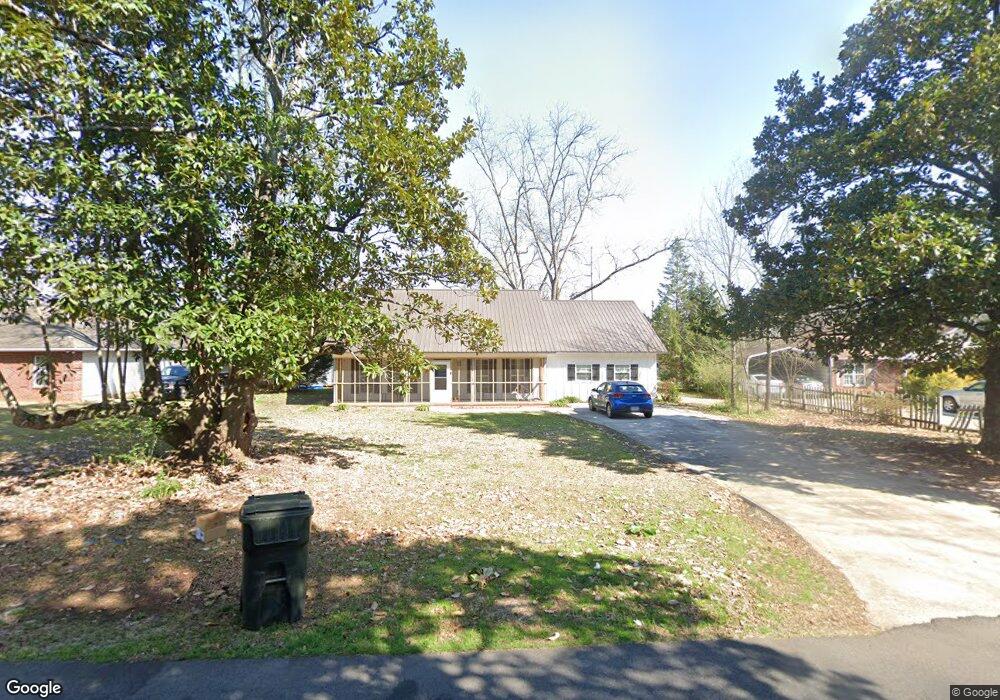
702 Anderson Ave Unit ANDERSON AVE Fort Valley, GA 31030
Estimated Value: $220,000 - $251,000
4
Beds
3
Baths
2,082
Sq Ft
$112/Sq Ft
Est. Value
About This Home
This home is located at 702 Anderson Ave Unit ANDERSON AVE, Fort Valley, GA 31030 and is currently estimated at $234,210, approximately $112 per square foot. 702 Anderson Ave Unit ANDERSON AVE is a home located in Peach County with nearby schools including Hunt Elementary School, Fort Valley Middle School, and Peach County High School.
Ownership History
Date
Name
Owned For
Owner Type
Purchase Details
Closed on
Jan 21, 2022
Sold by
Willeby Tristan Ryan
Bought by
Avant Latrina Hazel and Owens Matthew
Current Estimated Value
Home Financials for this Owner
Home Financials are based on the most recent Mortgage that was taken out on this home.
Original Mortgage
$191,468
Outstanding Balance
$177,232
Interest Rate
3.45%
Mortgage Type
FHA
Estimated Equity
$56,978
Purchase Details
Closed on
Dec 13, 2019
Sold by
Run Creek Holdings Llc
Bought by
Willeby Tristan Ryan
Home Financials for this Owner
Home Financials are based on the most recent Mortgage that was taken out on this home.
Original Mortgage
$151,182
Interest Rate
3.7%
Mortgage Type
VA
Purchase Details
Closed on
Oct 10, 2003
Sold by
C & H Properties Inc
Bought by
Hooker Andrea
Purchase Details
Closed on
Mar 3, 2003
Sold by
Evans Investment Company
Bought by
C & H Properties Inc
Create a Home Valuation Report for This Property
The Home Valuation Report is an in-depth analysis detailing your home's value as well as a comparison with similar homes in the area
Home Values in the Area
Average Home Value in this Area
Purchase History
| Date | Buyer | Sale Price | Title Company |
|---|---|---|---|
| Avant Latrina Hazel | $195,000 | -- | |
| Willeby Tristan Ryan | $148,000 | -- | |
| Hooker Andrea | $106,500 | -- | |
| C & H Properties Inc | -- | -- |
Source: Public Records
Mortgage History
| Date | Status | Borrower | Loan Amount |
|---|---|---|---|
| Open | Avant Latrina Hazel | $191,468 | |
| Previous Owner | Willeby Tristan Ryan | $151,182 |
Source: Public Records
Tax History Compared to Growth
Tax History
| Year | Tax Paid | Tax Assessment Tax Assessment Total Assessment is a certain percentage of the fair market value that is determined by local assessors to be the total taxable value of land and additions on the property. | Land | Improvement |
|---|---|---|---|---|
| 2024 | $3,755 | $90,080 | $3,760 | $86,320 |
| 2023 | $3,209 | $76,560 | $3,040 | $73,520 |
| 2022 | $1,926 | $71,560 | $3,040 | $68,520 |
| 2021 | $2,544 | $53,880 | $3,000 | $50,880 |
| 2020 | $2,250 | $48,680 | $3,000 | $45,680 |
| 2019 | $1,874 | $41,760 | $3,000 | $38,760 |
| 2018 | $1,880 | $41,760 | $3,000 | $38,760 |
| 2017 | $1,755 | $41,760 | $3,000 | $38,760 |
| 2016 | $1,981 | $47,080 | $3,000 | $44,080 |
| 2015 | $1,425 | $47,080 | $3,000 | $44,080 |
| 2014 | $1,362 | $45,040 | $3,000 | $42,040 |
| 2013 | -- | $45,040 | $3,000 | $42,040 |
Source: Public Records
Map
Nearby Homes
- 702 Anderson Ave
- 704 Anderson Ave
- 700 Anderson Ave
- 608 Anderson Ave
- 801 Anderson Ave
- 701 Anderson Ave
- 606 Anderson Ave
- 705 Anderson Ave
- 605 Anderson Ave
- 604 Anderson Ave
- 303 Schley St
- 302 Wilson Ln
- 602 Anderson Ave
- 603 Anderson Ave Unit A
- 603 Anderson Ave
- 603 Anderson Ave Unit A
- 305 Schley St
- 303 Wilson Ln
- 302 Schley St
- 304 Wilson Ln