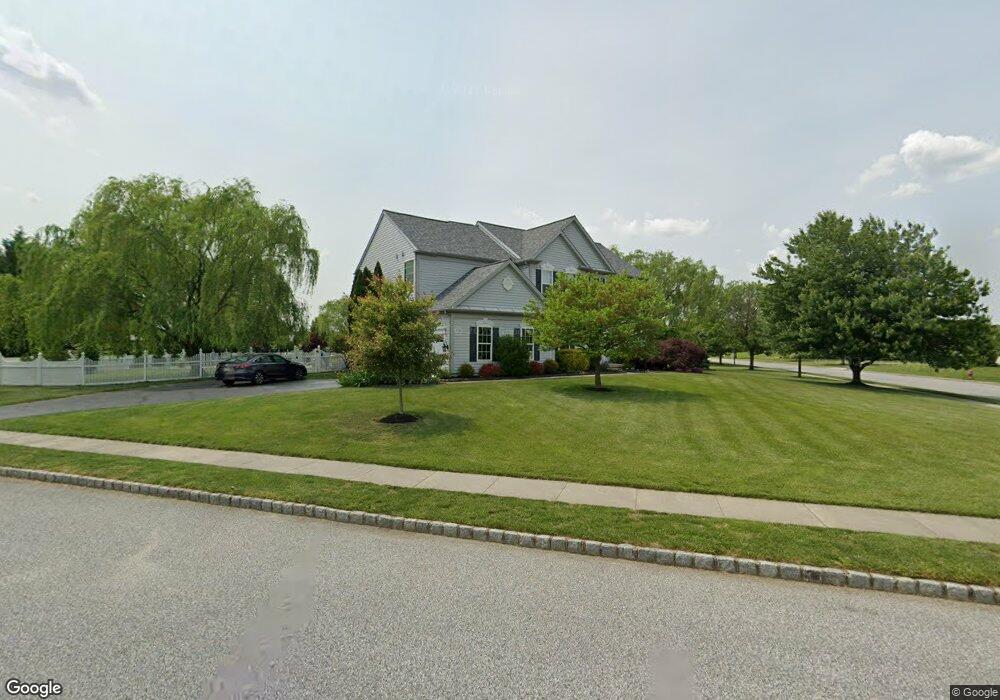
702 Clark Dr Mullica Hill, NJ 08062
Estimated Value: $747,000 - $811,000
--
Bed
--
Bath
2,985
Sq Ft
$259/Sq Ft
Est. Value
About This Home
This home is located at 702 Clark Dr, Mullica Hill, NJ 08062 and is currently estimated at $771,637, approximately $258 per square foot. 702 Clark Dr is a home located in Gloucester County with nearby schools including Harrison Township Elementary School, Pleasant Valley School, and Clearview Regional Middle School.
Ownership History
Date
Name
Owned For
Owner Type
Purchase Details
Closed on
Nov 30, 2007
Sold by
Hershowitz Mark and Hershowitz Tanna S
Bought by
Elsworth Richard and Elsworth Jennifer Anne
Current Estimated Value
Home Financials for this Owner
Home Financials are based on the most recent Mortgage that was taken out on this home.
Original Mortgage
$384,000
Outstanding Balance
$243,934
Interest Rate
6.37%
Mortgage Type
Purchase Money Mortgage
Estimated Equity
$527,703
Purchase Details
Closed on
Aug 13, 2003
Sold by
Pulte Homes Of Nj Lp
Bought by
Hershowitz Mark and Fleming Tanna S
Home Financials for this Owner
Home Financials are based on the most recent Mortgage that was taken out on this home.
Original Mortgage
$282,590
Interest Rate
6.35%
Mortgage Type
Purchase Money Mortgage
Create a Home Valuation Report for This Property
The Home Valuation Report is an in-depth analysis detailing your home's value as well as a comparison with similar homes in the area
Home Values in the Area
Average Home Value in this Area
Purchase History
| Date | Buyer | Sale Price | Title Company |
|---|---|---|---|
| Elsworth Richard | $480,000 | Elite Choice Title Llc | |
| Hershowitz Mark | $353,890 | Surety |
Source: Public Records
Mortgage History
| Date | Status | Borrower | Loan Amount |
|---|---|---|---|
| Open | Elsworth Richard | $384,000 | |
| Previous Owner | Hershowitz Mark | $282,590 |
Source: Public Records
Tax History Compared to Growth
Tax History
| Year | Tax Paid | Tax Assessment Tax Assessment Total Assessment is a certain percentage of the fair market value that is determined by local assessors to be the total taxable value of land and additions on the property. | Land | Improvement |
|---|---|---|---|---|
| 2025 | $13,884 | $414,700 | $90,000 | $324,700 |
| 2024 | $13,420 | $414,700 | $90,000 | $324,700 |
| 2023 | $13,420 | $414,700 | $90,000 | $324,700 |
| 2022 | $13,287 | $414,700 | $90,000 | $324,700 |
| 2021 | $12,980 | $414,700 | $90,000 | $324,700 |
| 2020 | $12,731 | $414,700 | $90,000 | $324,700 |
| 2019 | $12,350 | $414,700 | $90,000 | $324,700 |
| 2018 | $12,010 | $414,700 | $90,000 | $324,700 |
| 2017 | $11,715 | $414,700 | $90,000 | $324,700 |
| 2016 | $11,066 | $370,100 | $75,000 | $295,100 |
| 2015 | $10,751 | $370,100 | $75,000 | $295,100 |
| 2014 | $10,315 | $355,600 | $75,000 | $280,600 |
Source: Public Records
Map
Nearby Homes
- 121 White Owl Trail
- 19 Valley Ln
- 185 Woodland Ave
- 53 Redkist Dr
- 55 Redkist Dr
- 57 Redkist Dr
- 59 Redkist Dr
- 34 Redkist Dr
- 65 Redkist Dr
- 32 Redkist Dr
- 72 Redkist Dr
- 67 Redkist Dr
- 69 Redkist Dr
- 28 Redkist Dr
- 74 Redkist Dr
- 71 Redkist Dr
- 83 Redkist Dr
- 76 Redkist Dr
- Carriage Home-Ashford Plan at Orchard View at Mullica Hill - Carriage Homes
- Belford Plan at Orchard View at Mullica Hill