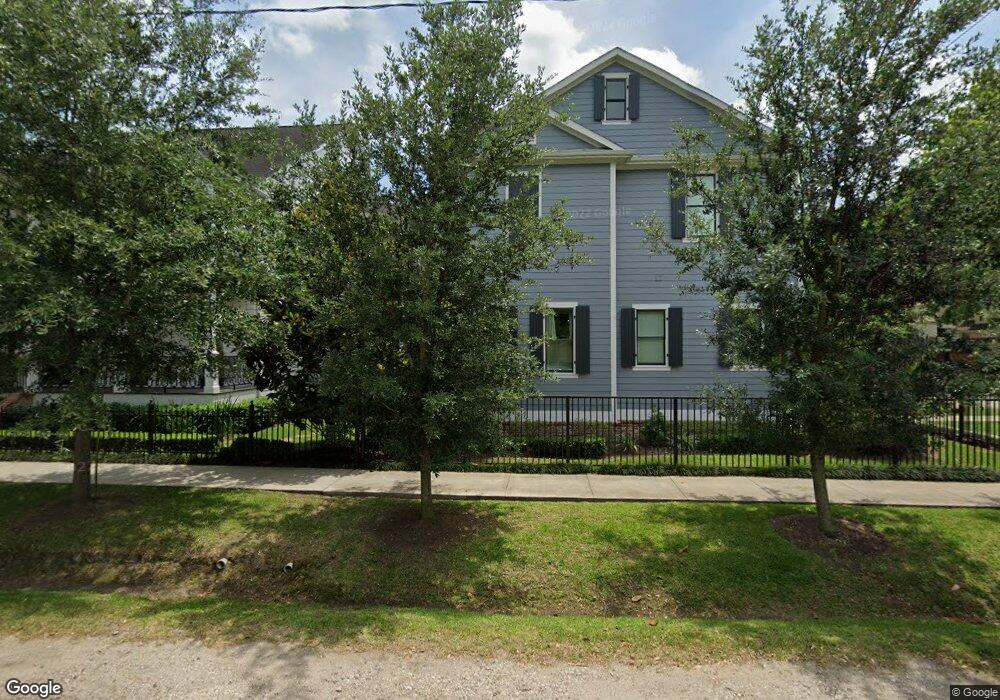
702 E 10th 1/2 St Houston, TX 77008
Greater Heights NeighborhoodEstimated Value: $2,148,000 - $2,466,000
2
Beds
1
Bath
1,620
Sq Ft
$1,420/Sq Ft
Est. Value
About This Home
This home is located at 702 E 10th 1/2 St, Houston, TX 77008 and is currently estimated at $2,300,080, approximately $1,419 per square foot. 702 E 10th 1/2 St is a home located in Harris County with nearby schools including Harvard Elementary School, Hogg Middle, and Heights High School.
Ownership History
Date
Name
Owned For
Owner Type
Purchase Details
Closed on
Jan 12, 2018
Sold by
Wall Properties Llc
Bought by
Davidson Micahe B and Davidson Autumn L
Current Estimated Value
Home Financials for this Owner
Home Financials are based on the most recent Mortgage that was taken out on this home.
Original Mortgage
$1,395,000
Outstanding Balance
$1,159,620
Interest Rate
3.37%
Mortgage Type
Adjustable Rate Mortgage/ARM
Estimated Equity
$1,140,460
Purchase Details
Closed on
Aug 1, 2014
Sold by
Campbell Stuart E and Campbell Lisa T
Bought by
Wall Properties Llc
Home Financials for this Owner
Home Financials are based on the most recent Mortgage that was taken out on this home.
Original Mortgage
$750,000
Interest Rate
4.2%
Mortgage Type
New Conventional
Create a Home Valuation Report for This Property
The Home Valuation Report is an in-depth analysis detailing your home's value as well as a comparison with similar homes in the area
Home Values in the Area
Average Home Value in this Area
Purchase History
| Date | Buyer | Sale Price | Title Company |
|---|---|---|---|
| Davidson Micahe B | -- | None Available | |
| Wall Properties Llc | -- | -- | |
| Wall Properties Llc | -- | -- |
Source: Public Records
Mortgage History
| Date | Status | Borrower | Loan Amount |
|---|---|---|---|
| Open | Davidson Micahe B | $1,395,000 | |
| Previous Owner | Wall Properties Llc | $750,000 |
Source: Public Records
Tax History Compared to Growth
Tax History
| Year | Tax Paid | Tax Assessment Tax Assessment Total Assessment is a certain percentage of the fair market value that is determined by local assessors to be the total taxable value of land and additions on the property. | Land | Improvement |
|---|---|---|---|---|
| 2025 | $34,822 | $2,267,706 | $562,500 | $1,705,206 |
| 2024 | $34,822 | $2,128,511 | $562,500 | $1,566,011 |
| 2023 | $34,822 | $2,312,806 | $562,500 | $1,750,306 |
| 2022 | $42,379 | $1,924,686 | $500,000 | $1,424,686 |
| 2021 | $42,306 | $1,859,194 | $500,000 | $1,359,194 |
| 2020 | $39,960 | $1,650,167 | $450,000 | $1,200,167 |
| 2019 | $39,073 | $1,544,121 | $450,000 | $1,094,121 |
| 2018 | $38,382 | $1,516,825 | $450,000 | $1,066,825 |
| 2017 | $21,410 | $846,716 | $450,000 | $396,716 |
| 2016 | $10,272 | $406,250 | $406,250 | $0 |
| 2015 | $7,920 | $343,750 | $343,750 | $0 |
| 2014 | $7,920 | $308,085 | $250,000 | $58,085 |
Source: Public Records
Map
Nearby Homes
- 643 E 10th St
- 716 E 10th St
- 602 E 10th 1/2 St
- 1111 Studewood St Unit 503
- 729 E 9th St
- 515 E 9th St
- 1114 W Cottage St
- 1033 Highland St
- 701 E 8th St
- 921 Arlington St
- 3541 Michaux St
- 710 E 13th St
- 4008 Norhill Blvd
- 1011 W Cottage St
- 1222 Arlington St
- 844 Cortlandt St
- 931 Merrill St
- 815 Arlington St
- 1032 Key St
- 1023 Euclid St
- 1012 Beverly St
- 706 E 10th 1/2 St
- 710 E 10th 1/2 St
- 644 E 10th 1/2 St
- 701 E 10th St
- 703 E 10th St
- 707 E 10th St
- 640 E 10th 1/2 St
- 640 E 10th 1 2 St
- 716 E 10th 1/2 St
- 715 E 10th St
- 715 E 10th St
- 715 E 10th St Unit 719A
- 715 E 10th St
- 705 E 10th 1/2 St
- 718 E 10th 1/2 St
- 725 E 10th 1/2 St Unit B
- 705 E 10 1 2 St
- 636 E 10th 1/2 St
- 711 E 10 1 2 St