Estimated Value: $157,000 - $179,000
3
Beds
2
Baths
1,230
Sq Ft
$137/Sq Ft
Est. Value
About This Home
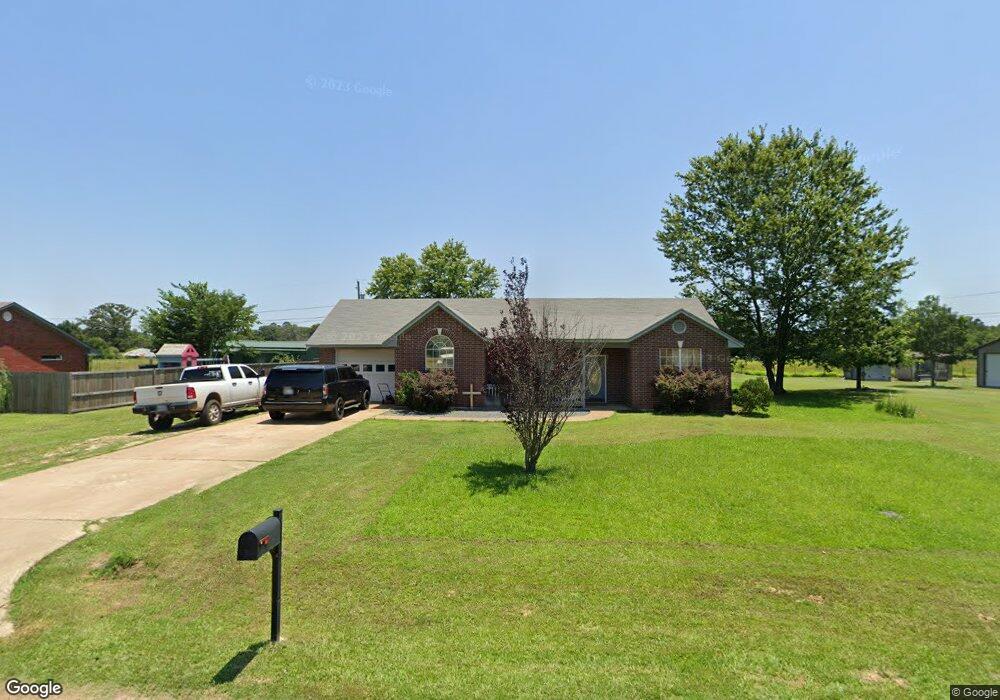
This home is located at 702 E 13th St Unit 706, Hooks, TX 75561 and is currently estimated at $168,398, approximately $136 per square foot. 702 E 13th St Unit 706 is a home located in Bowie County with nearby schools including Hooks Elementary School, Hooks Junior High School, and Hooks High School.
Ownership History
Date
Name
Owned For
Owner Type
Purchase Details
Closed on
Feb 26, 2021
Sold by
Ballard Jimmy and Ballard Janine
Bought by
Ballard Jerry Ellis and Ballard Miriam M
Current Estimated Value
Home Financials for this Owner
Home Financials are based on the most recent Mortgage that was taken out on this home.
Original Mortgage
$78,500
Outstanding Balance
$57,385
Interest Rate
2.7%
Mortgage Type
Commercial
Estimated Equity
$111,013
Purchase Details
Closed on
Oct 21, 2016
Sold by
Hill Lucas C and Hill Tiffany
Bought by
Ballard Jimmy and Ballard Janine
Home Financials for this Owner
Home Financials are based on the most recent Mortgage that was taken out on this home.
Original Mortgage
$93,279
Interest Rate
3.87%
Mortgage Type
FHA
Purchase Details
Closed on
Jun 2, 2008
Sold by
Hill Breanne
Bought by
Hill Lucas Cole
Create a Home Valuation Report for This Property
The Home Valuation Report is an in-depth analysis detailing your home's value as well as a comparison with similar homes in the area
Home Values in the Area
Average Home Value in this Area
Purchase History
| Date | Buyer | Sale Price | Title Company |
|---|---|---|---|
| Ballard Jerry Ellis | -- | None Available | |
| Ballard Jimmy | -- | Twin City Title Company | |
| Hill Lucas Cole | -- | None Available |
Source: Public Records
Mortgage History
| Date | Status | Borrower | Loan Amount |
|---|---|---|---|
| Open | Ballard Jerry Ellis | $78,500 | |
| Closed | Ballard Jimmy | $93,279 |
Source: Public Records
Tax History
| Year | Tax Paid | Tax Assessment Tax Assessment Total Assessment is a certain percentage of the fair market value that is determined by local assessors to be the total taxable value of land and additions on the property. | Land | Improvement |
|---|---|---|---|---|
| 2025 | $3,732 | $160,915 | $12,000 | $148,915 |
| 2024 | $3,732 | $160,425 | $12,000 | $148,425 |
| 2023 | $3,617 | $152,280 | $12,000 | $140,280 |
| 2022 | $3,422 | $137,761 | $12,000 | $125,761 |
| 2021 | $2,800 | $102,089 | $12,000 | $90,089 |
| 2020 | $2,710 | $98,015 | $12,000 | $86,015 |
| 2019 | $2,694 | $94,139 | $12,000 | $82,139 |
| 2018 | $2,661 | $92,993 | $12,000 | $80,993 |
| 2017 | $2,617 | $91,498 | $12,000 | $79,498 |
| 2016 | $2,559 | $89,478 | $12,000 | $77,478 |
| 2015 | $2,158 | $88,745 | $12,000 | $76,745 |
| 2014 | $2,158 | $85,905 | $12,000 | $73,905 |
Source: Public Records
Map
Nearby Homes
- 203 Garden Rd
- 1301 E Avenue A
- 107 Garden Rd
- 119 Roosevelt Rd
- 204 E 9th St
- 704 E Avenue E
- 107 Marshall St
- 201 Roosevelt Rd
- 207 Marshall St
- 210 E 9th St
- 202 Roosevelt Rd
- 103 E 19th St
- 204 Roosevelt Rd
- 603 E Avenue D
- 209 Roosevelt Rd
- 109 E 7th St
- 2001 E 20th St
- 310 Roosevelt Rd
- 2 Somervell
- 201A Roosevelt
Your Personal Tour Guide
Ask me questions while you tour the home.