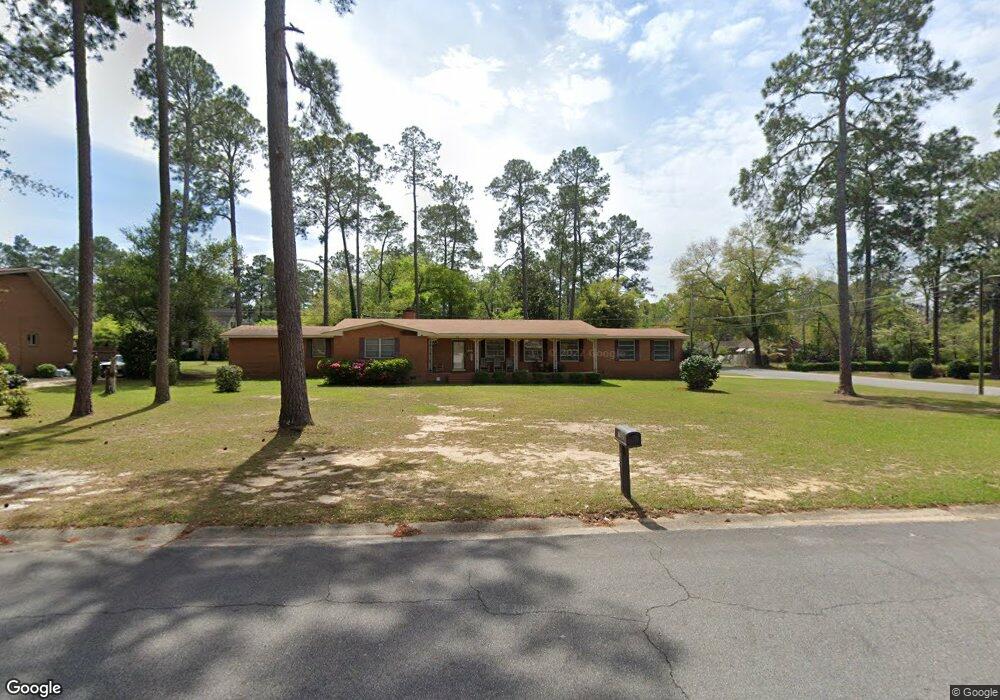
702 E 18th Ave Cordele, GA 31015
Estimated Value: $188,013 - $265,000
3
Beds
2
Baths
2,829
Sq Ft
$76/Sq Ft
Est. Value
About This Home
This home is located at 702 E 18th Ave, Cordele, GA 31015 and is currently estimated at $215,003, approximately $75 per square foot. 702 E 18th Ave is a home located in Crisp County with nearby schools including Crisp County Elementary School, Crisp County Primary School, and Crisp County Middle School.
Ownership History
Date
Name
Owned For
Owner Type
Purchase Details
Closed on
Aug 20, 2004
Sold by
Howard Bennie J
Bought by
Howard Bennie J and Howard Rosie T
Current Estimated Value
Purchase Details
Closed on
Mar 22, 2004
Sold by
Roobin Mike*
Bought by
Howard Bennie J
Purchase Details
Closed on
Oct 7, 2003
Sold by
Roobin David Bazemore*
Bought by
Roobin Mike
Purchase Details
Closed on
Jul 25, 1945
Bought by
Roobin Sam
Create a Home Valuation Report for This Property
The Home Valuation Report is an in-depth analysis detailing your home's value as well as a comparison with similar homes in the area
Purchase History
| Date | Buyer | Sale Price | Title Company |
|---|---|---|---|
| Howard Bennie J | -- | -- | |
| Howard Bennie J | $95,000 | -- | |
| Roobin Mike | $41,400 | -- | |
| Roobin Sam | -- | -- |
Source: Public Records
Tax History
| Year | Tax Paid | Tax Assessment Tax Assessment Total Assessment is a certain percentage of the fair market value that is determined by local assessors to be the total taxable value of land and additions on the property. | Land | Improvement |
|---|---|---|---|---|
| 2025 | -- | $74,526 | $7,168 | $67,358 |
| 2024 | -- | $68,014 | $7,168 | $60,846 |
| 2023 | $678 | $61,173 | $3,584 | $57,589 |
| 2022 | $1,113 | $57,917 | $3,584 | $54,333 |
| 2021 | $1,091 | $54,661 | $3,584 | $51,077 |
| 2020 | $1,091 | $54,661 | $3,584 | $51,077 |
| 2019 | $1,099 | $54,661 | $3,584 | $51,077 |
| 2018 | $1,617 | $56,866 | $6,810 | $50,056 |
| 2017 | $2,309 | $56,866 | $6,810 | $50,056 |
| 2016 | $1,622 | $56,866 | $6,810 | $50,056 |
| 2015 | -- | $56,865 | $6,810 | $50,056 |
| 2014 | -- | $56,865 | $6,810 | $50,056 |
| 2013 | -- | $56,865 | $6,809 | $50,055 |
Source: Public Records
Map
Nearby Homes
Your Personal Tour Guide
Ask me questions while you tour the home.