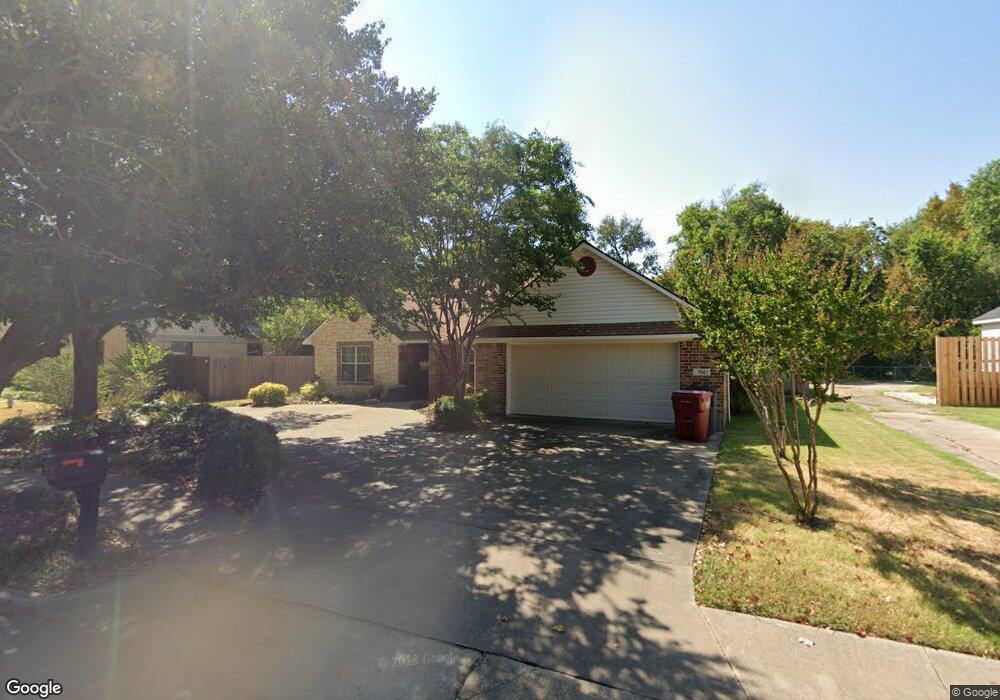
702 E 9th St Bonham, TX 75418
Estimated Value: $248,000 - $332,000
3
Beds
2
Baths
1,785
Sq Ft
$156/Sq Ft
Est. Value
About This Home
This home is located at 702 E 9th St, Bonham, TX 75418 and is currently estimated at $279,306, approximately $156 per square foot. 702 E 9th St is a home located in Fannin County with nearby schools including Evans Elementary School, Finley-Oates Elementary School, and LH Rather Jr High School.
Ownership History
Date
Name
Owned For
Owner Type
Purchase Details
Closed on
Sep 30, 2008
Sold by
Hartwell Alvin B and Hartwell Construction
Bought by
Kennedy Kerry D and Kennedy Kimberly Yk
Current Estimated Value
Home Financials for this Owner
Home Financials are based on the most recent Mortgage that was taken out on this home.
Original Mortgage
$110,580
Outstanding Balance
$73,250
Interest Rate
6.52%
Mortgage Type
New Conventional
Estimated Equity
$206,056
Create a Home Valuation Report for This Property
The Home Valuation Report is an in-depth analysis detailing your home's value as well as a comparison with similar homes in the area
Purchase History
| Date | Buyer | Sale Price | Title Company |
|---|---|---|---|
| Kennedy Kerry D | -- | None Available |
Source: Public Records
Mortgage History
| Date | Status | Borrower | Loan Amount |
|---|---|---|---|
| Open | Kennedy Kerry D | $110,580 |
Source: Public Records
Tax History
| Year | Tax Paid | Tax Assessment Tax Assessment Total Assessment is a certain percentage of the fair market value that is determined by local assessors to be the total taxable value of land and additions on the property. | Land | Improvement |
|---|---|---|---|---|
| 2025 | $5,216 | $299,160 | $42,230 | $256,930 |
| 2024 | $3,733 | $301,940 | $40,220 | $261,720 |
| 2023 | $4,382 | $289,160 | $38,710 | $250,450 |
| 2022 | $4,443 | $259,810 | $27,150 | $232,660 |
| 2021 | $4,642 | $203,550 | $13,070 | $190,480 |
| 2020 | $4,227 | $194,730 | $10,150 | $184,580 |
| 2019 | $3,995 | $187,500 | $9,850 | $177,650 |
| 2018 | $3,627 | $174,560 | $9,750 | $164,810 |
| 2017 | $3,175 | $134,080 | $4,620 | $129,460 |
| 2016 | $2,887 | $112,940 | $4,620 | $108,320 |
| 2015 | -- | $106,560 | $4,420 | $102,140 |
| 2014 | -- | $101,240 | $3,590 | $97,650 |
Source: Public Records
Map
Nearby Homes
Your Personal Tour Guide
Ask me questions while you tour the home.