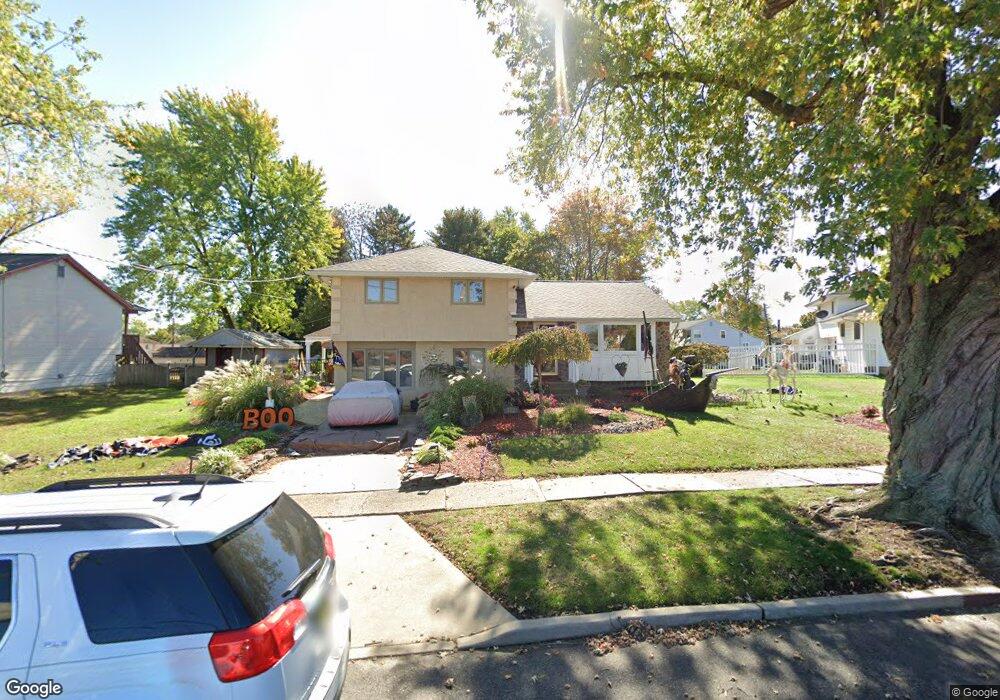
702 E Evesham Rd Glendora, NJ 08029
Estimated Value: $337,904 - $388,000
Studio
--
Bath
1,550
Sq Ft
$239/Sq Ft
Est. Value
About This Home
This home is located at 702 E Evesham Rd, Glendora, NJ 08029 and is currently estimated at $369,976, approximately $238 per square foot. 702 E Evesham Rd is a home located in Camden County with nearby schools including Glen Landing Middle School, Triton High School, and St. Teresa Regional School.
Ownership History
Date
Name
Owned For
Owner Type
Purchase Details
Closed on
Mar 29, 2002
Sold by
Greco Rita D
Bought by
Jusino Candace J
Current Estimated Value
Home Financials for this Owner
Home Financials are based on the most recent Mortgage that was taken out on this home.
Original Mortgage
$133,929
Outstanding Balance
$56,786
Interest Rate
7.13%
Mortgage Type
FHA
Estimated Equity
$313,190
Purchase Details
Closed on
Aug 28, 1995
Sold by
Pezzano Garry
Bought by
Grecco Rita
Home Financials for this Owner
Home Financials are based on the most recent Mortgage that was taken out on this home.
Original Mortgage
$69,000
Interest Rate
7.61%
Create a Home Valuation Report for This Property
The Home Valuation Report is an in-depth analysis detailing your home's value as well as a comparison with similar homes in the area
Home Values in the Area
Average Home Value in this Area
Purchase History
| Date | Buyer | Sale Price | Title Company |
|---|---|---|---|
| Jusino Candace J | $135,000 | -- | |
| Grecco Rita | $114,500 | -- |
Source: Public Records
Mortgage History
| Date | Status | Borrower | Loan Amount |
|---|---|---|---|
| Open | Jusino Candace J | $133,929 | |
| Previous Owner | Grecco Rita | $69,000 |
Source: Public Records
Tax History
| Year | Tax Paid | Tax Assessment Tax Assessment Total Assessment is a certain percentage of the fair market value that is determined by local assessors to be the total taxable value of land and additions on the property. | Land | Improvement |
|---|---|---|---|---|
| 2025 | $7,687 | $181,900 | $55,300 | $126,600 |
| 2024 | $7,431 | $181,900 | $55,300 | $126,600 |
| 2023 | $7,431 | $181,900 | $55,300 | $126,600 |
| 2022 | $7,391 | $181,900 | $55,300 | $126,600 |
| 2021 | $7,236 | $181,900 | $55,300 | $126,600 |
| 2020 | $7,241 | $181,900 | $55,300 | $126,600 |
| 2019 | $7,081 | $181,900 | $55,300 | $126,600 |
| 2018 | $7,050 | $181,900 | $55,300 | $126,600 |
| 2017 | $8,215 | $181,900 | $55,300 | $126,600 |
| 2016 | $6,672 | $181,900 | $55,300 | $126,600 |
| 2015 | $6,194 | $181,900 | $55,300 | $126,600 |
| 2014 | $6,157 | $181,900 | $55,300 | $126,600 |
Source: Public Records
Map
Nearby Homes
Your Personal Tour Guide
Ask me questions while you tour the home.