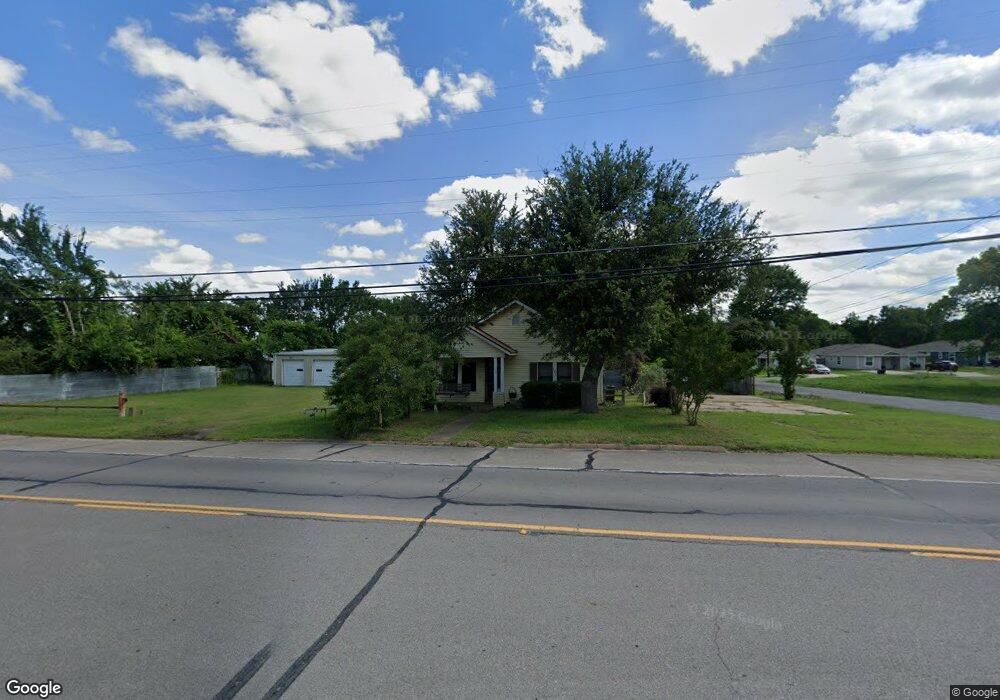
702 E Sam Rayburn Dr Bonham, TX 75418
Estimated Value: $105,665 - $124,000
Studio
--
Bath
810
Sq Ft
$143/Sq Ft
Est. Value
About This Home
This home is located at 702 E Sam Rayburn Dr, Bonham, TX 75418 and is currently estimated at $115,916, approximately $143 per square foot. 702 E Sam Rayburn Dr is a home located in Fannin County with nearby schools including Evans Elementary School, Finley-Oates Elementary School, and LH Rather Jr High School.
Ownership History
Date
Name
Owned For
Owner Type
Purchase Details
Closed on
Apr 23, 2014
Sold by
Baker Daniel and Baker Gary
Bought by
Dixon Nelda F
Current Estimated Value
Purchase Details
Closed on
Sep 6, 2007
Sold by
Dixon Nelda
Bought by
Dixon Keith
Create a Home Valuation Report for This Property
The Home Valuation Report is an in-depth analysis detailing your home's value as well as a comparison with similar homes in the area
Purchase History
| Date | Buyer | Sale Price | Title Company |
|---|---|---|---|
| Dixon Nelda F | -- | None Available | |
| Dixon Keith | -- | None Available |
Source: Public Records
Tax History
| Year | Tax Paid | Tax Assessment Tax Assessment Total Assessment is a certain percentage of the fair market value that is determined by local assessors to be the total taxable value of land and additions on the property. | Land | Improvement |
|---|---|---|---|---|
| 2025 | $1,525 | $96,830 | $52,940 | $43,890 |
| 2024 | $1,271 | $75,890 | $41,530 | $34,360 |
| 2023 | $1,076 | $54,590 | $20,380 | $34,210 |
| 2022 | $1,185 | $53,870 | $20,380 | $33,490 |
| 2021 | $816 | $32,270 | $5,010 | $27,260 |
| 2020 | $785 | $30,700 | $2,870 | $27,830 |
| 2019 | $685 | $26,990 | $1,410 | $25,580 |
| 2018 | $622 | $25,000 | $1,240 | $23,760 |
| 2017 | $544 | $21,300 | $1,080 | $20,220 |
| 2016 | $503 | $19,670 | $1,080 | $18,590 |
| 2015 | -- | $18,350 | $1,030 | $17,320 |
| 2014 | -- | $19,120 | $1,030 | $18,090 |
Source: Public Records
Map
Nearby Homes
- 619 E 3rd St
- 616 E 3rd St
- 701 E 3rd St
- 728 E Sam Rayburn Dr
- 604 E 3rd St Unit 2
- 604 E 3rd St Unit A & B
- 604 E 3rd St
- 612 E 3rd St Unit 1
- 612 E 3rd St
- 703 E Sam Rayburn Dr
- 726 E Sam Rayburn Dr
- 700 E 3rd St
- 602 E Sam Rayburn Dr
- 620 E Sam Rayburn Dr Unit RAYBURN
- 730 E Sam Rayburn Dr
- 619 E Sam Rayburn Dr
- 619 E 2nd St
- 605 E 3rd St Unit A
- 605 E 3rd St
- 305 Katy Blvd
Your Personal Tour Guide
Ask me questions while you tour the home.