R
Landlord's Agent in 2024
Roy Saylor
Saylor Real Estate Group
(812) 614-7777
37 Total Sales

Estimated Value: $158,301 - $209,000
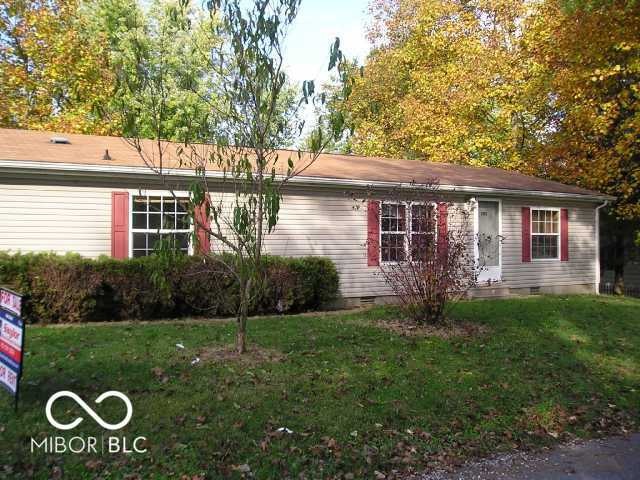
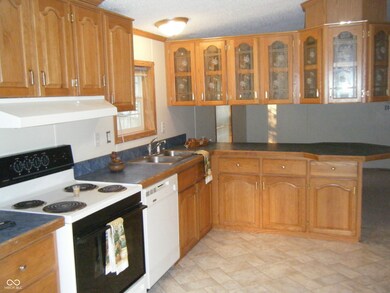
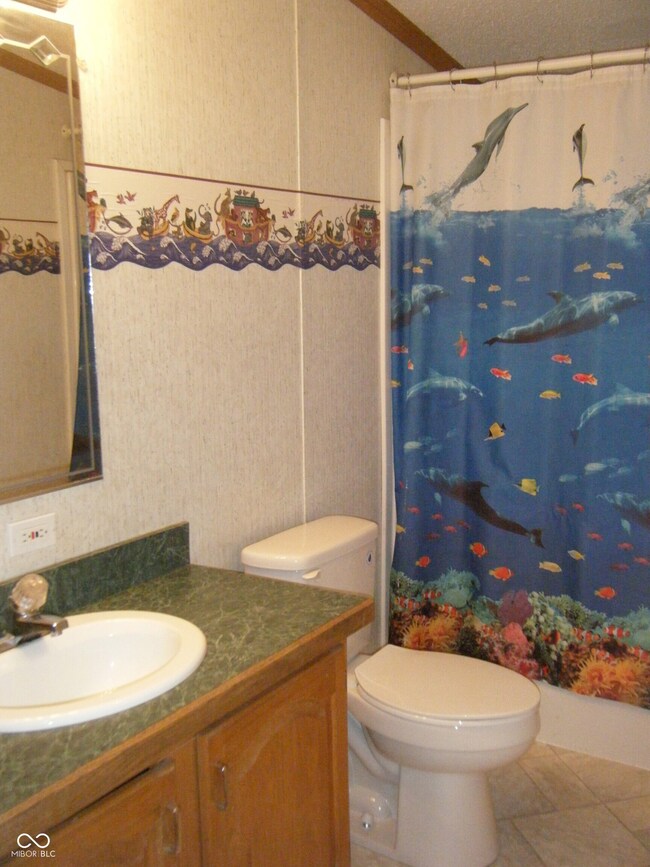
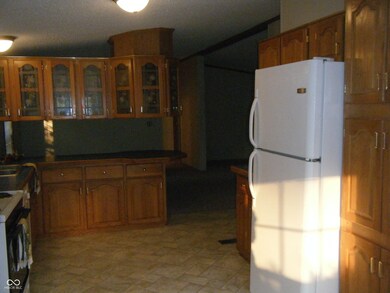
Three bedroom two bath total electric ranch style manufactured home with new vinyl flooring, new water heater, fresh paint and 8x12 utility shed.
Last Agent to Rent the Property
Saylor Real Estate Group License #RB14029027 Listed on: 12/10/2024
| Date | Event | Price | List to Sale | Price per Sq Ft | Prior Sale |
|---|---|---|---|---|---|
| 12/20/2024 12/20/24 | Rented | $1,195 | 0.0% | -- | |
| 12/19/2024 12/19/24 | Under Contract | -- | -- | -- | |
| 12/10/2024 12/10/24 | For Rent | $1,195 | 0.0% | -- | |
| 05/24/2022 05/24/22 | Sold | $895 | 0.0% | -- | View Prior Sale |
| 05/17/2022 05/17/22 | Pending | -- | -- | -- | |
| 05/12/2022 05/12/22 | For Sale | $895 | 0.0% | -- | |
| 10/26/2020 10/26/20 | Rented | $850 | 0.0% | -- | |
| 10/22/2020 10/22/20 | Under Contract | -- | -- | -- | |
| 10/07/2020 10/07/20 | For Rent | $850 | +3.0% | -- | |
| 08/16/2019 08/16/19 | Rented | $825 | +3.8% | -- | |
| 07/03/2019 07/03/19 | For Rent | $795 | +9.7% | -- | |
| 05/03/2014 05/03/14 | Rented | $725 | 0.0% | -- | |
| 05/02/2014 05/02/14 | Under Contract | -- | -- | -- | |
| 04/03/2014 04/03/14 | For Rent | $725 | +4.3% | -- | |
| 03/27/2012 03/27/12 | Rented | $695 | -99.0% | -- | |
| 03/25/2012 03/25/12 | Under Contract | -- | -- | -- | |
| 06/10/2011 06/10/11 | For Rent | $72,500 | -- | -- |
| Year | Tax Paid | Tax Assessment Tax Assessment Total Assessment is a certain percentage of the fair market value that is determined by local assessors to be the total taxable value of land and additions on the property. | Land | Improvement |
|---|---|---|---|---|
| 2025 | $1,126 | $92,000 | $14,100 | $77,900 |
| 2024 | $1,126 | $68,000 | $10,100 | $57,900 |
| 2023 | $1,007 | $56,200 | $10,100 | $46,100 |
| 2022 | $948 | $52,800 | $10,100 | $42,700 |
| 2021 | $930 | $46,400 | $10,100 | $36,300 |
| 2020 | $781 | $39,000 | $7,300 | $31,700 |
| 2019 | $700 | $34,900 | $7,300 | $27,600 |
| 2018 | $698 | $34,900 | $7,300 | $27,600 |
| 2017 | $666 | $34,900 | $7,300 | $27,600 |
| 2016 | $548 | $28,900 | $6,500 | $22,400 |
| 2014 | $605 | $32,100 | $6,500 | $25,600 |
| 2013 | $650 | $32,800 | $6,500 | $26,300 |
R
Landlord's Agent in 2024
Roy Saylor
Saylor Real Estate Group
(812) 614-7777
37 Total Sales
J
Seller Co-Listing Agent in 2012
Julie Franklin
RE/MAX Tower
Source: MIBOR Broker Listing Cooperative®
MLS Number: 22014519
APN: 16-14-31-340-015.000-014
Disclaimer: Certain information contained herein is derived from information provided by parties other than Homes.com. All information provided is deemed reliable, but is not guaranteed to be accurate and should be independently verified.
![]() Based on information submitted to the MLS GRID. All data is obtained from various sources and may not have been verified by broker or MLS GRID. Supplied Open House Information is subject to change without notice. All information should be independently reviewed and verified for accuracy. Properties may or may not be listed by the office/agent presenting the information. Some IDX listings have been excluded from this website.
Based on information submitted to the MLS GRID. All data is obtained from various sources and may not have been verified by broker or MLS GRID. Supplied Open House Information is subject to change without notice. All information should be independently reviewed and verified for accuracy. Properties may or may not be listed by the office/agent presenting the information. Some IDX listings have been excluded from this website.
Based on information submitted to the MLS GRID
Ask me questions while you tour the home.
