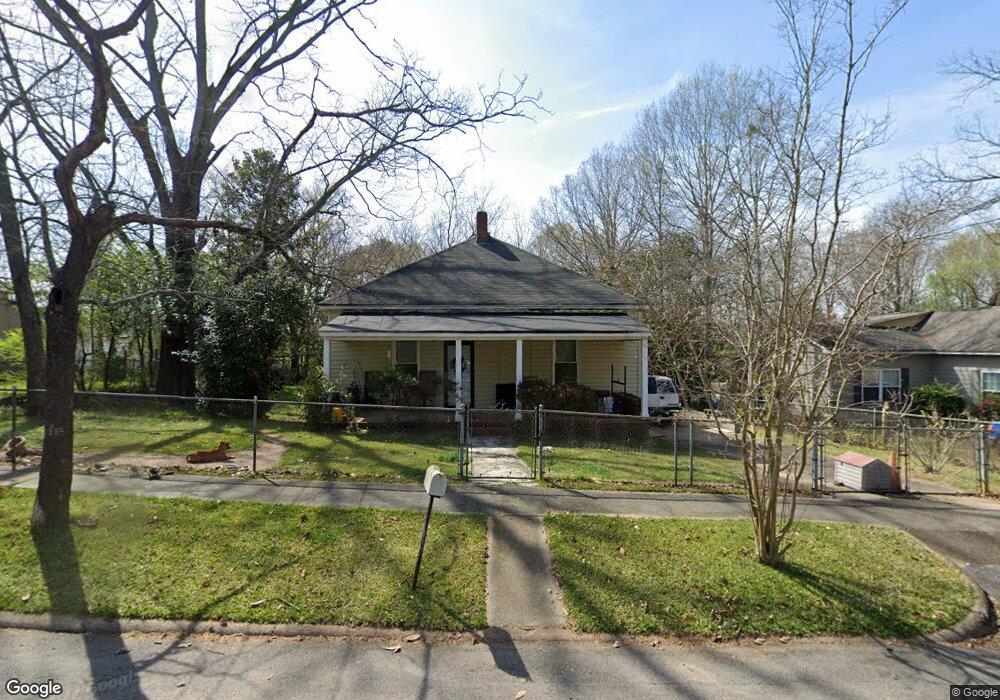
702 Elm St Lagrange, GA 30240
Estimated Value: $101,000 - $194,000
3
Beds
2
Baths
1,550
Sq Ft
$96/Sq Ft
Est. Value
About This Home
This home is located at 702 Elm St, Lagrange, GA 30240 and is currently estimated at $148,653, approximately $95 per square foot. 702 Elm St is a home located in Troup County with nearby schools including Ethel W. Kight Elementary School, Hollis Hand Elementary School, and Franklin Forest Elementary School.
Ownership History
Date
Name
Owned For
Owner Type
Purchase Details
Closed on
Jun 29, 2001
Sold by
David Jacqueline B and David Lee Black
Bought by
Hill Melanie C
Current Estimated Value
Purchase Details
Closed on
Jul 30, 1999
Sold by
Jacquelin B Black
Bought by
David Jacqueline B and David Lee Black
Purchase Details
Closed on
Jul 29, 1999
Sold by
April Coleman S
Bought by
Jacquelin B Black
Purchase Details
Closed on
Apr 18, 1991
Sold by
Hester Julia B
Bought by
April Coleman S
Purchase Details
Closed on
Sep 4, 1987
Sold by
Hester Jimmy B
Bought by
Hester Julia B
Purchase Details
Closed on
May 19, 1987
Sold by
Rosser Robert B Etal
Bought by
Hester Jimmy B
Purchase Details
Closed on
Jul 15, 1985
Sold by
Rosser J Robert
Bought by
Rosser Robert B Etal
Purchase Details
Closed on
Oct 21, 1981
Sold by
Carruth Cara Harper
Bought by
Rosser J Robert
Create a Home Valuation Report for This Property
The Home Valuation Report is an in-depth analysis detailing your home's value as well as a comparison with similar homes in the area
Purchase History
| Date | Buyer | Sale Price | Title Company |
|---|---|---|---|
| Hill Melanie C | $56,000 | -- | |
| David Jacqueline B | -- | -- | |
| Jacquelin B Black | -- | -- | |
| April Coleman S | $25,000 | -- | |
| Hester Julia B | -- | -- | |
| Hester Jimmy B | $18,000 | -- | |
| Rosser Robert B Etal | -- | -- | |
| Rosser J Robert | -- | -- |
Source: Public Records
Tax History
| Year | Tax Paid | Tax Assessment Tax Assessment Total Assessment is a certain percentage of the fair market value that is determined by local assessors to be the total taxable value of land and additions on the property. | Land | Improvement |
|---|---|---|---|---|
| 2025 | $1,015 | $40,920 | $4,360 | $36,560 |
| 2024 | $929 | $36,040 | $4,360 | $31,680 |
| 2023 | $371 | $33,480 | $4,360 | $29,120 |
| 2022 | $806 | $30,880 | $4,360 | $26,520 |
| 2021 | $751 | $26,888 | $4,360 | $22,528 |
| 2020 | $751 | $26,888 | $4,360 | $22,528 |
| 2019 | $684 | $24,684 | $4,360 | $20,324 |
| 2018 | $655 | $23,700 | $4,416 | $19,284 |
| 2017 | $655 | $23,700 | $4,416 | $19,284 |
| 2016 | $647 | $23,425 | $4,416 | $19,009 |
| 2015 | $648 | $23,425 | $4,416 | $19,009 |
| 2014 | $696 | $24,972 | $4,416 | $20,556 |
| 2013 | -- | $25,644 | $4,416 | $21,228 |
Source: Public Records
Map
Nearby Homes
Your Personal Tour Guide
Ask me questions while you tour the home.