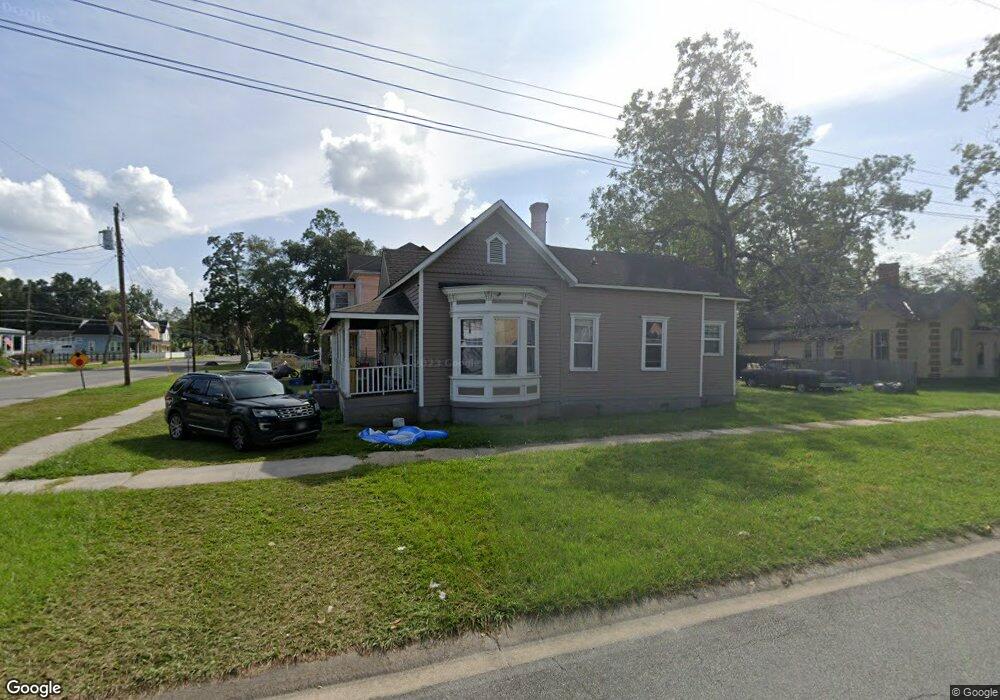
702 Gilmore St Waycross, GA 31501
Estimated Value: $68,000 - $155,000
3
Beds
2
Baths
1,616
Sq Ft
$62/Sq Ft
Est. Value
About This Home
This home is located at 702 Gilmore St, Waycross, GA 31501 and is currently estimated at $100,186, approximately $61 per square foot. 702 Gilmore St is a home located in Ware County with nearby schools including Ruskin Elementary School, Ware County Middle School, and Ware County High School.
Ownership History
Date
Name
Owned For
Owner Type
Purchase Details
Closed on
Jan 2, 2024
Sold by
George Gregory D
Bought by
Pifer Hetzel Allen
Current Estimated Value
Purchase Details
Closed on
Dec 15, 2023
Sold by
Pifer Hetzel Allen
Bought by
George Gregory D
Purchase Details
Closed on
Jun 8, 2018
Sold by
Tillman Charley L
Bought by
Pifer Hetzel Allen
Purchase Details
Closed on
Apr 18, 2017
Sold by
Anderson P
Bought by
Tillman Charley L and Tillman Evelyn
Purchase Details
Closed on
Sep 24, 2009
Sold by
Anderson Junior P
Bought by
Anderson Junior P and Anderson Anna P
Purchase Details
Closed on
Apr 23, 2007
Sold by
Williams Phyllis Melton
Bought by
Anderson Junior R
Purchase Details
Closed on
Jan 5, 2004
Sold by
Melton Stacy and Melton Phyll
Bought by
Melton Phyllis
Purchase Details
Closed on
Jul 1, 1996
Sold by
Hull Joe and Hull Kathlee M
Bought by
Melton Stacy and Melton Phyll
Purchase Details
Closed on
Sep 24, 1993
Bought by
Hull Joe and Hull Kathlee M
Purchase Details
Closed on
Jul 6, 1978
Create a Home Valuation Report for This Property
The Home Valuation Report is an in-depth analysis detailing your home's value as well as a comparison with similar homes in the area
Home Values in the Area
Average Home Value in this Area
Purchase History
| Date | Buyer | Sale Price | Title Company |
|---|---|---|---|
| Pifer Hetzel Allen | $19,000 | -- | |
| George Gregory D | $13,000 | -- | |
| Pifer Hetzel Allen | $85,000 | -- | |
| Tillman Charley L | $27,000 | -- | |
| Anderson Junior P | -- | -- | |
| Anderson Junior R | $15,000 | -- | |
| Melton Phyllis | -- | -- | |
| Melton Stacy | $17,100 | -- | |
| Hull Joe | -- | -- | |
| -- | -- | -- |
Source: Public Records
Tax History Compared to Growth
Tax History
| Year | Tax Paid | Tax Assessment Tax Assessment Total Assessment is a certain percentage of the fair market value that is determined by local assessors to be the total taxable value of land and additions on the property. | Land | Improvement |
|---|---|---|---|---|
| 2024 | $690 | $22,359 | $980 | $21,379 |
| 2023 | $704 | $23,333 | $700 | $22,633 |
| 2022 | $776 | $23,333 | $700 | $22,633 |
| 2021 | $849 | $19,624 | $700 | $18,924 |
| 2020 | $841 | $19,305 | $700 | $18,605 |
| 2019 | $818 | $18,508 | $700 | $17,808 |
| 2018 | $482 | $17,711 | $700 | $17,011 |
| 2017 | $447 | $10,247 | $700 | $9,547 |
| 2016 | $447 | $10,247 | $700 | $9,547 |
| 2015 | $450 | $10,247 | $700 | $9,547 |
| 2014 | $449 | $10,247 | $700 | $9,547 |
| 2013 | -- | $10,247 | $700 | $9,547 |
Source: Public Records
Map
Nearby Homes
- 705 Gilmore St
- 805 Brunel St
- 306 Lee Ave
- 418 Reed St
- 615 Morton Ave
- 803 Elizabeth St
- 1021 Lee Ave
- 1304 Brunel St
- 516 Folks St
- 506 McDonald St
- 1103 Ann St
- 503 N Nicholls St
- 505 N Nicholls St
- 629 Remshart St
- 1003 Carswell Ave
- 1125 Georgia St
- 502 Dewey St
- 601 N Nicholls St
- 924 Highsmith St
- 415 Dewey St