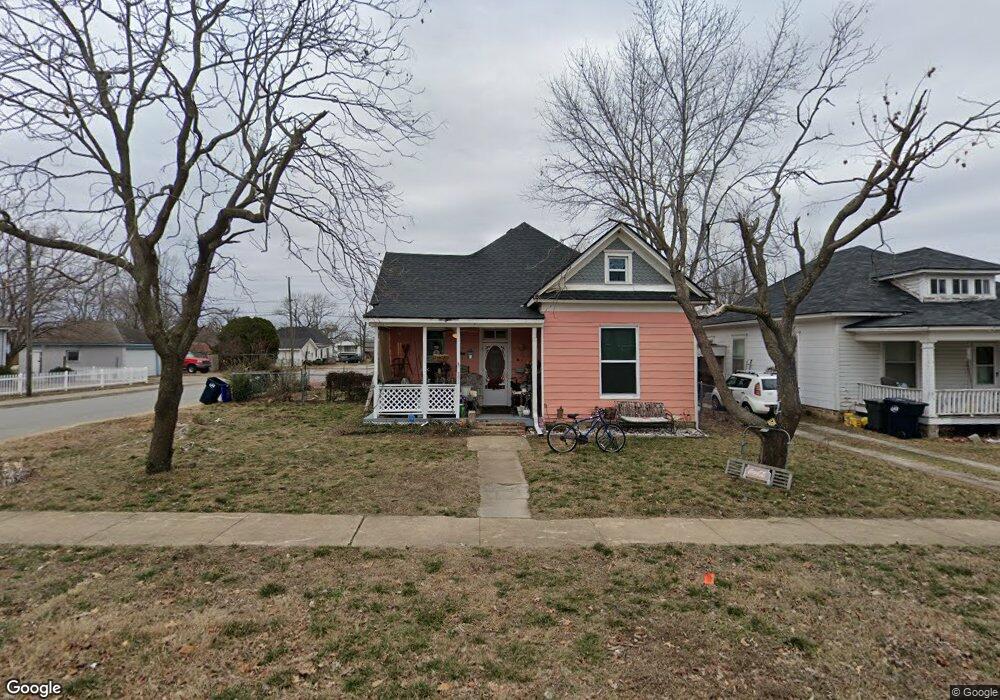
702 N 3rd St Rogers, AR 72756
Estimated Value: $237,212 - $318,000
Studio
1
Bath
1,228
Sq Ft
$228/Sq Ft
Est. Value
About This Home
This home is located at 702 N 3rd St, Rogers, AR 72756 and is currently estimated at $279,553, approximately $227 per square foot. 702 N 3rd St is a home located in Benton County with nearby schools including Frank Tillery Elementary School, Lingle Middle School, and Rogers Heritage High School.
Ownership History
Date
Name
Owned For
Owner Type
Purchase Details
Closed on
Jul 30, 2019
Sold by
Smith William E
Bought by
Hamilton Ivy J
Current Estimated Value
Purchase Details
Closed on
Jun 26, 2013
Sold by
Hamilton Jodi L
Bought by
Smith William E
Purchase Details
Closed on
Oct 18, 2006
Sold by
Siversen Nancy L and Stair Joseph B
Bought by
Hamilton Jodi Lee
Home Financials for this Owner
Home Financials are based on the most recent Mortgage that was taken out on this home.
Original Mortgage
$65,000
Interest Rate
6.37%
Mortgage Type
Purchase Money Mortgage
Purchase Details
Closed on
Jul 31, 1997
Bought by
Stair Trust
Purchase Details
Closed on
Jul 17, 1997
Bought by
Stair Rev Trust
Purchase Details
Closed on
Aug 11, 1989
Bought by
Stair
Purchase Details
Closed on
Jun 14, 1988
Bought by
Davis
Create a Home Valuation Report for This Property
The Home Valuation Report is an in-depth analysis detailing your home's value as well as a comparison with similar homes in the area
Home Values in the Area
Average Home Value in this Area
Purchase History
| Date | Buyer | Sale Price | Title Company |
|---|---|---|---|
| Hamilton Ivy J | -- | None Available | |
| Smith William E | -- | None Available | |
| Hamilton Jodi Lee | $85,000 | None Available | |
| Stair Trust | -- | -- | |
| Stair Rev Trust | -- | -- | |
| Stair | $40,000 | -- | |
| Davis | $19,500 | -- | |
| David | $17,000 | -- | |
| Lay | $16,000 | -- | |
| Butler | $15,000 | -- | |
| Erickson | $15,000 | -- |
Source: Public Records
Mortgage History
| Date | Status | Borrower | Loan Amount |
|---|---|---|---|
| Previous Owner | Hamilton Jodi Lee | $65,000 |
Source: Public Records
Tax History
| Year | Tax Paid | Tax Assessment Tax Assessment Total Assessment is a certain percentage of the fair market value that is determined by local assessors to be the total taxable value of land and additions on the property. | Land | Improvement |
|---|---|---|---|---|
| 2025 | $1,034 | $40,474 | $19,000 | $21,474 |
| 2024 | $963 | $35,105 | $19,000 | $16,105 |
| 2023 | $917 | $24,650 | $8,000 | $16,650 |
| 2022 | $537 | $24,650 | $8,000 | $16,650 |
| 2021 | $493 | $24,650 | $8,000 | $16,650 |
| 2020 | $453 | $15,080 | $2,400 | $12,680 |
| 2019 | $453 | $15,080 | $2,400 | $12,680 |
| 2018 | $828 | $15,080 | $2,400 | $12,680 |
| 2017 | $783 | $15,080 | $2,400 | $12,680 |
| 2016 | $783 | $15,080 | $2,400 | $12,680 |
| 2015 | $853 | $16,130 | $3,400 | $12,730 |
| 2014 | $853 | $16,130 | $3,400 | $12,730 |
Source: Public Records
Map
Nearby Homes
- 615 N 3rd St
- 615 & 615 1/2 N 3rd St
- 403 6th St
- 718 W Maple St
- 510 N 8th St
- 220 N C St
- 201 E Walnut St
- Lot 34, 1109 N 9th St
- Lot 33, 1109 N 9th St
- Lot 35, 1109 N 9th St
- 805 W Norwood St
- 803 W Maple St
- 508 E Spruce St
- 908 N 9th St
- 418,420,422,424 N F St
- 0 Sears Unit 1324915
- 208 N 9th St
- 1409 N Arkansas St
- 509 E Walnut St
- 1014 W Olive St Unit 8
Your Personal Tour Guide
Ask me questions while you tour the home.