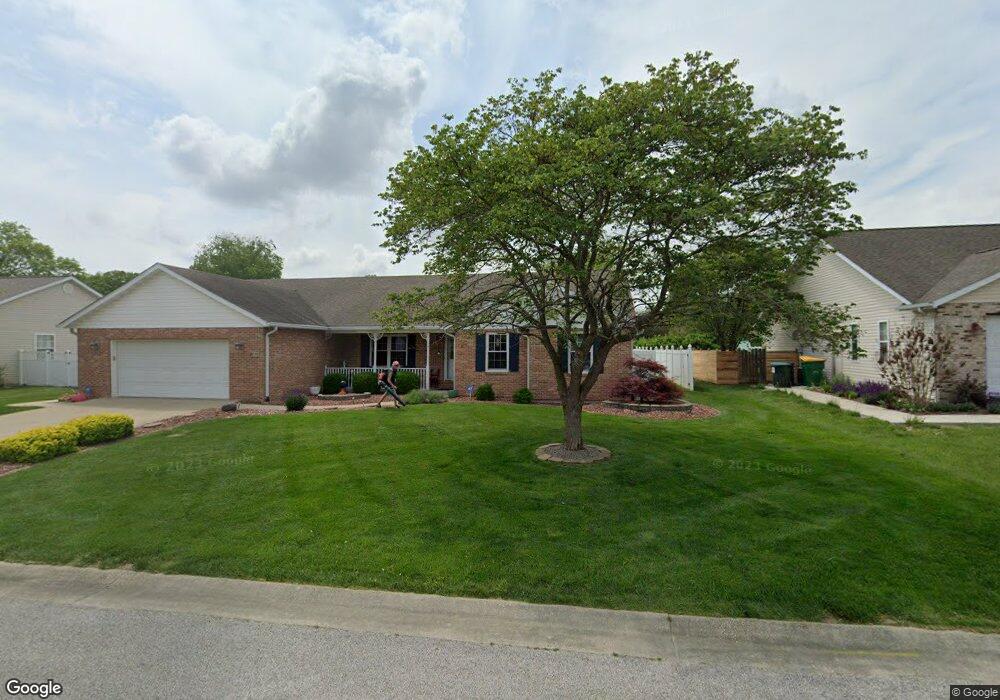
702 N Kristie Lynn St Freeburg, IL 62243
Estimated Value: $264,000 - $335,673
--
Bed
--
Bath
1,997
Sq Ft
$156/Sq Ft
Est. Value
About This Home
This home is located at 702 N Kristie Lynn St, Freeburg, IL 62243 and is currently estimated at $310,918, approximately $155 per square foot. 702 N Kristie Lynn St is a home located in St. Clair County with nearby schools including Freeburg Elementary School, Freeburg Community High School, and St. Joseph Catholic School.
Ownership History
Date
Name
Owned For
Owner Type
Purchase Details
Closed on
Jan 18, 2024
Sold by
Lanterman Patrick D and Lanterman Todd E
Bought by
Lanterman Ronald
Current Estimated Value
Purchase Details
Closed on
Jun 17, 2020
Sold by
Lanterman Ronald and Lanterman Nancy
Bought by
Lanterman Ronald and Lanterman Patrick D
Purchase Details
Closed on
Mar 11, 2005
Sold by
Rachell James R and Rachell Judy C
Bought by
Lanterman Ronald and Lanterman Nancy
Home Financials for this Owner
Home Financials are based on the most recent Mortgage that was taken out on this home.
Original Mortgage
$115,000
Interest Rate
5.67%
Mortgage Type
Fannie Mae Freddie Mac
Purchase Details
Closed on
Feb 2, 2001
Sold by
Sheppard William E and Sheppard Phyllis J
Bought by
Rachell James R and Rachell Judy C
Create a Home Valuation Report for This Property
The Home Valuation Report is an in-depth analysis detailing your home's value as well as a comparison with similar homes in the area
Home Values in the Area
Average Home Value in this Area
Purchase History
| Date | Buyer | Sale Price | Title Company |
|---|---|---|---|
| Lanterman Ronald | -- | None Available | |
| Lanterman Ronald | -- | Attorney | |
| Lanterman Ronald | $182,500 | Nations Title Agency Of Miss | |
| Rachell James R | $153,000 | -- |
Source: Public Records
Mortgage History
| Date | Status | Borrower | Loan Amount |
|---|---|---|---|
| Previous Owner | Lanterman Ronald | $115,000 |
Source: Public Records
Tax History Compared to Growth
Tax History
| Year | Tax Paid | Tax Assessment Tax Assessment Total Assessment is a certain percentage of the fair market value that is determined by local assessors to be the total taxable value of land and additions on the property. | Land | Improvement |
|---|---|---|---|---|
| 2024 | $6,528 | $89,077 | $16,904 | $72,173 |
| 2023 | $6,358 | $85,973 | $16,315 | $69,658 |
| 2022 | $6,029 | $80,560 | $15,288 | $65,272 |
| 2021 | $5,783 | $75,843 | $14,393 | $61,450 |
| 2020 | $5,472 | $68,998 | $13,094 | $55,904 |
| 2019 | $5,103 | $67,830 | $13,535 | $54,295 |
| 2018 | $5,005 | $66,933 | $13,356 | $53,577 |
| 2017 | $2,409 | $63,995 | $12,769 | $51,226 |
| 2016 | $4,687 | $64,778 | $12,238 | $52,540 |
| 2014 | $2,122 | $62,829 | $12,558 | $50,271 |
| 2013 | $4,453 | $62,269 | $12,446 | $49,823 |
Source: Public Records
Map
Nearby Homes
- 3 Park St
- 0 Hickory Dr
- 103 Draco Dr
- 109 Willow Dr
- 111 Willow Dr
- 106 S Vine St
- 207 N Edison St
- 401 N Edison St
- 312 W Phillips St
- 206 N Main St
- 302 N Railroad St
- 520 N Edison St
- tbb Illinois 15
- 420 Foxtail Dr
- 440 Foxtail Dr
- 433 Foxtail Dr
- 304 Torrington Ln
- 359 Sleeping Indian Dr
- 363 Sleeping Indian Dr
- 222 Alamosa Dr
- 700 N Kristie Lynn St
- 704 N Kristie Lynn St
- 1 Park St
- 706 N Kristie Lynn St
- 703 N Kristie Lynn St
- 5 Park St
- 701 N Kristie Lynn St
- 705 N Kristie Lynn St
- 7 Park St
- 707 N Kristie Lynn St
- 708 N Kristie Lynn St
- 425 Old Fayetteville Rd
- 415 Old Fayetteville Rd
- 702 Mary Ann Ct
- 704 Mary Ann Ct
- 709 N Kristie Lynn St
- 4 Park St
- 9 Park St
- 700 Mary Ann Ct
- 6 Park St