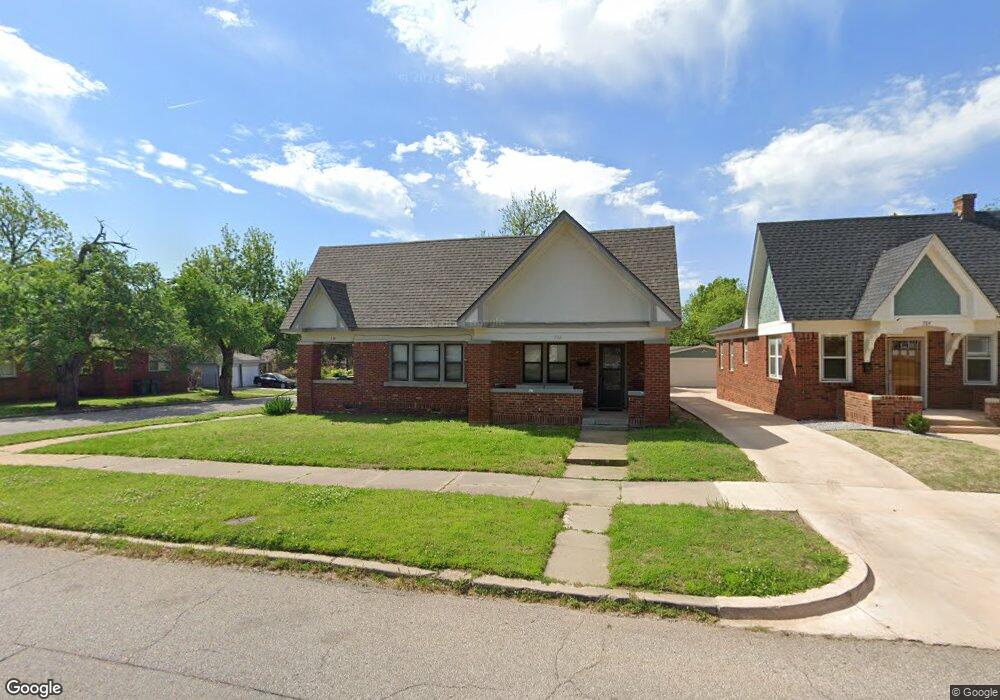
702 NW 25th St Oklahoma City, OK 73103
Paseo NeighborhoodEstimated Value: $256,000 - $505,000
4
Beds
2
Baths
1,911
Sq Ft
$184/Sq Ft
Est. Value
About This Home
This home is located at 702 NW 25th St, Oklahoma City, OK 73103 and is currently estimated at $350,738, approximately $183 per square foot. 702 NW 25th St is a home located in Oklahoma County with nearby schools including Wilson Elementary School, Moon Middle School, and F.D. Moon Middle School.
Ownership History
Date
Name
Owned For
Owner Type
Purchase Details
Closed on
Jun 13, 2019
Sold by
C & C Property Llc
Bought by
C & C Property Llc
Current Estimated Value
Purchase Details
Closed on
Jun 17, 2013
Sold by
Echh Lp
Bought by
Cwh Lp
Purchase Details
Closed on
Dec 19, 2003
Sold by
Cindel Llc
Bought by
Echh Lp
Purchase Details
Closed on
Dec 9, 2003
Sold by
Abbaszadeh Ayyoob D
Bought by
Cindel Llc
Purchase Details
Closed on
Jun 30, 1999
Sold by
Hill Mary Beth
Bought by
Real Surf Llc and Nones Marla Lavonne
Create a Home Valuation Report for This Property
The Home Valuation Report is an in-depth analysis detailing your home's value as well as a comparison with similar homes in the area
Home Values in the Area
Average Home Value in this Area
Purchase History
| Date | Buyer | Sale Price | Title Company |
|---|---|---|---|
| C & C Property Llc | -- | None Available | |
| Cwh Lp | -- | O S Title | |
| Echh Lp | -- | American Guaranty Title Co | |
| Cindel Llc | $152,500 | American Guaranty Title Co | |
| Real Surf Llc | $32,500 | -- |
Source: Public Records
Tax History Compared to Growth
Tax History
| Year | Tax Paid | Tax Assessment Tax Assessment Total Assessment is a certain percentage of the fair market value that is determined by local assessors to be the total taxable value of land and additions on the property. | Land | Improvement |
|---|---|---|---|---|
| 2024 | $2,282 | $19,513 | $2,096 | $17,417 |
| 2023 | $2,282 | $18,583 | $2,155 | $16,428 |
| 2022 | $2,082 | $17,698 | $3,001 | $14,697 |
| 2021 | $1,984 | $16,856 | $3,069 | $13,787 |
| 2020 | $1,912 | $16,054 | $3,816 | $12,238 |
| 2019 | $1,820 | $15,290 | $3,883 | $11,407 |
| 2018 | $1,327 | $11,696 | $0 | $0 |
| 2017 | $1,263 | $11,139 | $2,979 | $8,160 |
| 2016 | $1,203 | $10,608 | $2,744 | $7,864 |
| 2015 | $1,157 | $10,102 | $2,527 | $7,575 |
| 2014 | $1,095 | $9,622 | $2,831 | $6,791 |
Source: Public Records
Map
Nearby Homes