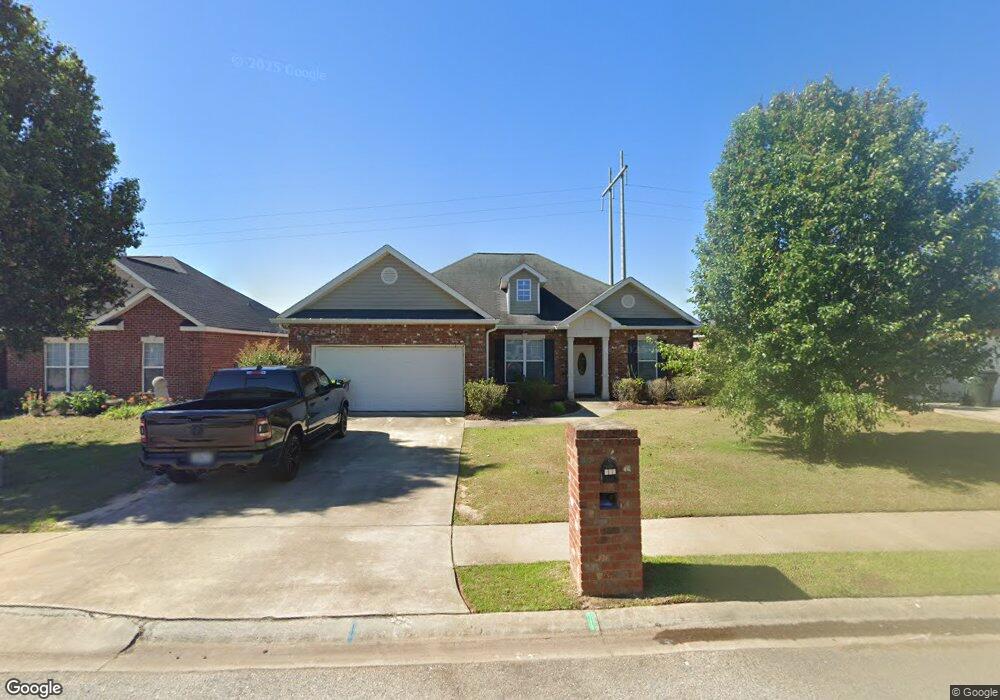
702 Post Oak Way Warner Robins, GA 31088
Estimated Value: $255,784 - $283,000
3
Beds
2
Baths
1,693
Sq Ft
$160/Sq Ft
Est. Value
About This Home
This home is located at 702 Post Oak Way, Warner Robins, GA 31088 and is currently estimated at $271,696, approximately $160 per square foot. 702 Post Oak Way is a home located in Houston County with nearby schools including Lake Joy Primary School, Lake Joy Elementary School, and Feagin Mill Middle School.
Ownership History
Date
Name
Owned For
Owner Type
Purchase Details
Closed on
Mar 1, 2019
Sold by
Everett James Cleveland
Bought by
Farr Danny R and Farr Stacey M
Current Estimated Value
Home Financials for this Owner
Home Financials are based on the most recent Mortgage that was taken out on this home.
Original Mortgage
$169,000
Outstanding Balance
$148,580
Interest Rate
4.4%
Mortgage Type
VA
Estimated Equity
$123,116
Purchase Details
Closed on
Sep 13, 2008
Sold by
Project Development & Management Llc
Bought by
Everett James Cleveland
Home Financials for this Owner
Home Financials are based on the most recent Mortgage that was taken out on this home.
Original Mortgage
$159,293
Interest Rate
6.45%
Mortgage Type
FHA
Purchase Details
Closed on
Mar 24, 2006
Sold by
Jaros Development Llc
Bought by
Jenlar Inc
Create a Home Valuation Report for This Property
The Home Valuation Report is an in-depth analysis detailing your home's value as well as a comparison with similar homes in the area
Home Values in the Area
Average Home Value in this Area
Purchase History
| Date | Buyer | Sale Price | Title Company |
|---|---|---|---|
| Farr Danny R | $169,000 | None Available | |
| Everett James Cleveland | $161,000 | None Available | |
| Jenlar Inc | $18,800 | -- |
Source: Public Records
Mortgage History
| Date | Status | Borrower | Loan Amount |
|---|---|---|---|
| Open | Farr Danny R | $169,000 | |
| Previous Owner | Everett James Cleveland | $159,293 |
Source: Public Records
Tax History
| Year | Tax Paid | Tax Assessment Tax Assessment Total Assessment is a certain percentage of the fair market value that is determined by local assessors to be the total taxable value of land and additions on the property. | Land | Improvement |
|---|---|---|---|---|
| 2024 | $3,030 | $92,600 | $10,000 | $82,600 |
| 2023 | $3,048 | $92,440 | $10,000 | $82,440 |
| 2022 | $1,840 | $80,040 | $10,000 | $70,040 |
| 2021 | $1,569 | $67,880 | $10,000 | $57,880 |
| 2020 | $1,571 | $67,640 | $10,000 | $57,640 |
| 2019 | $1,320 | $58,800 | $10,000 | $48,800 |
| 2018 | $1,320 | $58,800 | $10,000 | $48,800 |
| 2017 | $1,321 | $58,800 | $10,000 | $48,800 |
| 2016 | $1,323 | $58,800 | $10,000 | $48,800 |
| 2015 | -- | $58,800 | $10,000 | $48,800 |
| 2014 | -- | $60,640 | $10,000 | $50,640 |
| 2013 | -- | $60,640 | $10,000 | $50,640 |
Source: Public Records
Map
Nearby Homes
- 209 Flagler Way
- 104 Downshire Way
- 302 Erin Way
- 600 Post Oak Way
- 202 Avondale Cir
- 115 Lori Ln
- 229 Santa fe Trail
- 158 Holly Pointe
- 167 Holly Pointe
- 166 Holly Pointe
- 2920 U S 41
- 107 Rachael Ln
- 536 Childers Dr
- 901 Falkirk Dr
- 116 Sasanqua Dr
- 109 Sasanqua Dr
- 120 Legacy Ct
- 112 Legacy Ct
- 105 Welney Cir
- 104 Flora Cir
- 700 Post Oak Way Unit 54
- 700 Post Oak Way
- 704 Post Oak Way
- 648 Post Oak Way
- 706 Post Oak Way
- 646 Post Oak Way
- 708 Post Oak Way
- 404 Erin Way
- 703 Post Oak Way
- 112 Cole Ct
- 112 Cole Ct Unit 26
- 705 Post Oak Way
- 701 Post Oak Way
- 644 Post Oak Way
- 710 Post Oak Way
- 406 Erin Way
- 707 Post Oak Way
- 709 Post Oak Way
- 642 Post Oak Way
- 712 Post Oak Way
Your Personal Tour Guide
Ask me questions while you tour the home.