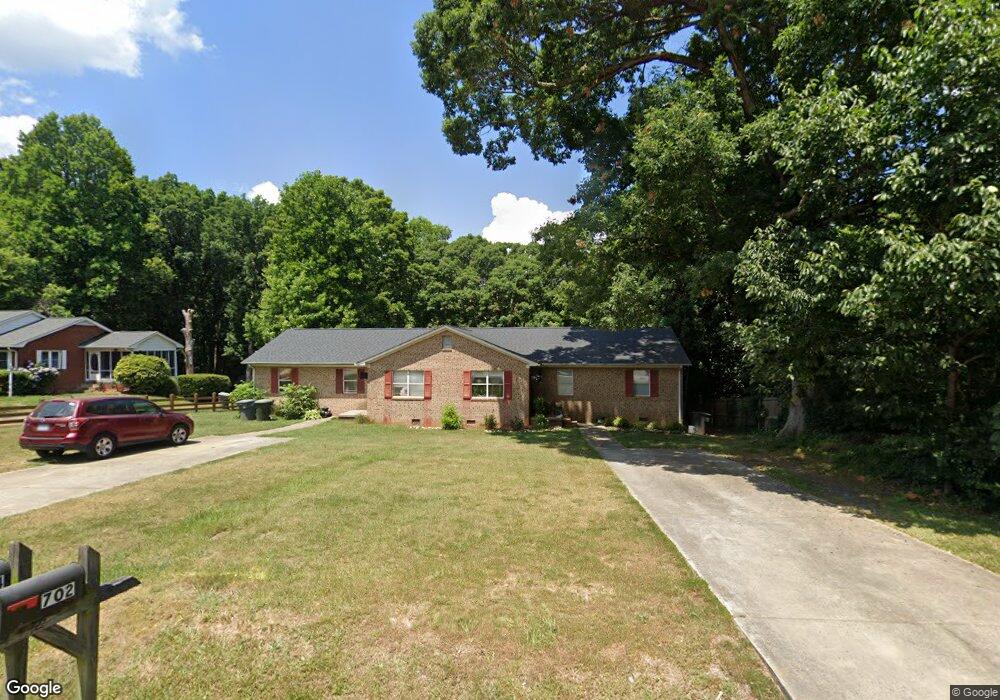
702 S Mccrary St Asheboro, NC 27203
Estimated Value: $233,219 - $284,000
--
Bed
2
Baths
2,176
Sq Ft
$118/Sq Ft
Est. Value
About This Home
This home is located at 702 S Mccrary St, Asheboro, NC 27203 and is currently estimated at $256,055, approximately $117 per square foot. 702 S Mccrary St is a home located in Randolph County with nearby schools including Donna L. Loflin Elementary School, South Asheboro Middle School, and Asheboro High School.
Ownership History
Date
Name
Owned For
Owner Type
Purchase Details
Closed on
Sep 26, 2025
Sold by
Weston James M and Weston Annette Catherine
Bought by
James M Weston Revocable Trust and Weston
Current Estimated Value
Purchase Details
Closed on
Feb 20, 2018
Sold by
Weston Martha K and Weston Marcus L
Bought by
Weston James W
Home Financials for this Owner
Home Financials are based on the most recent Mortgage that was taken out on this home.
Original Mortgage
$455,000
Interest Rate
4.32%
Mortgage Type
Future Advance Clause Open End Mortgage
Purchase Details
Closed on
Oct 31, 2014
Sold by
Weston Marcus L
Bought by
Weston James M
Purchase Details
Closed on
May 3, 1996
Bought by
Weston James M
Purchase Details
Closed on
Jun 2, 1992
Bought by
Weston James M
Purchase Details
Closed on
Jan 7, 1991
Bought by
Weston James M
Create a Home Valuation Report for This Property
The Home Valuation Report is an in-depth analysis detailing your home's value as well as a comparison with similar homes in the area
Home Values in the Area
Average Home Value in this Area
Purchase History
| Date | Buyer | Sale Price | Title Company |
|---|---|---|---|
| James M Weston Revocable Trust | -- | None Listed On Document | |
| Weston James W | -- | None Available | |
| Weston James M | -- | None Available | |
| Weston James M | $114,000 | -- | |
| Weston James M | $39,500 | -- | |
| Weston James M | $9,000 | -- |
Source: Public Records
Mortgage History
| Date | Status | Borrower | Loan Amount |
|---|---|---|---|
| Previous Owner | Weston James W | $455,000 |
Source: Public Records
Tax History Compared to Growth
Tax History
| Year | Tax Paid | Tax Assessment Tax Assessment Total Assessment is a certain percentage of the fair market value that is determined by local assessors to be the total taxable value of land and additions on the property. | Land | Improvement |
|---|---|---|---|---|
| 2024 | $2,041 | $161,720 | $30,660 | $131,060 |
| 2023 | $2,041 | $161,720 | $30,660 | $131,060 |
| 2022 | $1,621 | $112,460 | $21,460 | $91,000 |
| 2021 | $1,621 | $112,460 | $21,460 | $91,000 |
| 2020 | $1,621 | $112,460 | $21,460 | $91,000 |
| 2019 | $1,621 | $112,460 | $21,460 | $91,000 |
| 2018 | $1,448 | $98,700 | $18,460 | $80,240 |
| 2016 | $1,785 | $121,616 | $18,460 | $103,156 |
| 2015 | $1,788 | $121,616 | $18,460 | $103,156 |
| 2014 | -- | $121,616 | $18,460 | $103,156 |
Source: Public Records
Map
Nearby Homes
- 617 Uwharrie St Unit N
- 806 Windermere Ct
- 631 W Kivett St
- 401 Uwharrie St
- 828 Windermere Ct
- 645 W Wainman Ave
- 314 Pershing St
- 627 Lee St
- 799 William Ave
- 1037 Robbins St
- 711 Sunset Ave Unit E
- 830 Sunset Ave
- 135 Dixon St
- 612 Sunset Ave Unit 6
- 612 Sunset Ave Unit 5
- 211 Armfield Ave
- 209 Armfield Ave
- 923 Arnold St
- 272 Cheyenne Cir
- 223 Rich Ave
- 712 S Mccrary St
- 636 S Mccrary St
- 0 S Mccrary St
- 722 S Mccrary St
- 643 S Mccrary St
- 633 S Mccrary St
- 730 S Mccrary St
- 624 S Mccrary St
- 721 S Mccrary St
- 623 S Mccrary St
- 731 S Mccrary St
- 738 S Mccrary St
- 615 S Mccrary St
- 618 Uwharrie St
- 909 Powhatan Ave
- 903 Powhatan Ave
- 913 Powhatan Ave
- 917 Powhatan Ave
- 921 Powhatan Ave
- 1005 Powhatan Ave