Estimated Value: $323,992 - $349,000
--
Bed
5
Baths
2,176
Sq Ft
$156/Sq Ft
Est. Value
About This Home
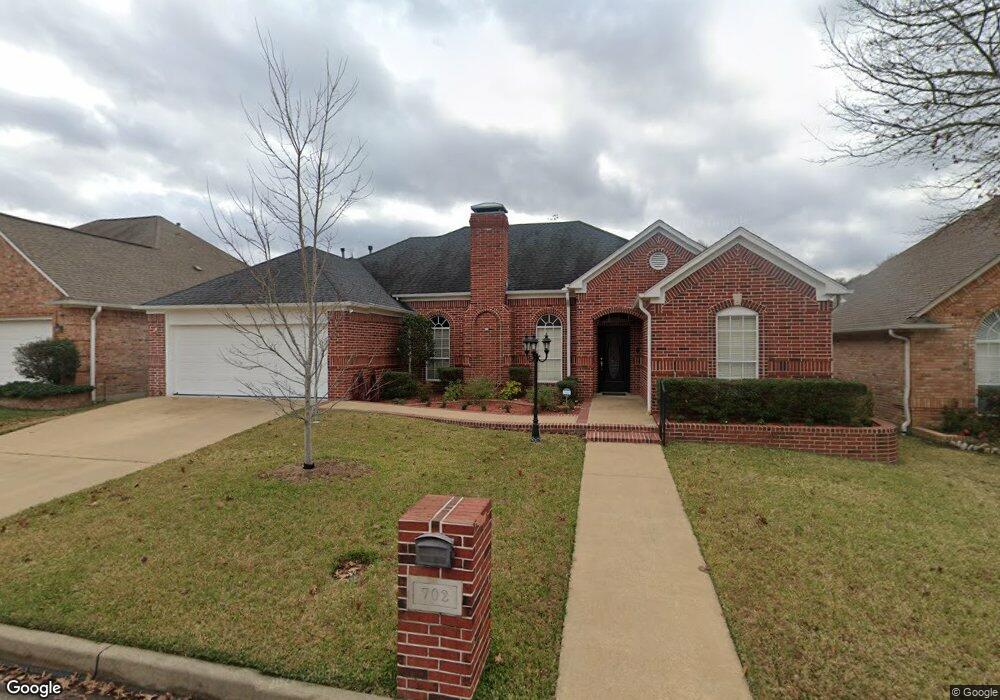
This home is located at 702 Shiloh Ridge St, Tyler, TX 75703 and is currently estimated at $339,248, approximately $155 per square foot. 702 Shiloh Ridge St is a home located in Smith County with nearby schools including Rice Elementary School, Hubbard Middle School, and Tyler Legacy High School.
Ownership History
Date
Name
Owned For
Owner Type
Purchase Details
Closed on
Jun 26, 2020
Sold by
Hermes Arthur P and Estate Of Kathryn Ellen Loram
Bought by
Kim Laura E
Current Estimated Value
Home Financials for this Owner
Home Financials are based on the most recent Mortgage that was taken out on this home.
Original Mortgage
$216,125
Outstanding Balance
$191,154
Interest Rate
3.2%
Mortgage Type
New Conventional
Estimated Equity
$148,094
Purchase Details
Closed on
Jul 11, 2017
Sold by
Black James L and Mcgill Black Peggy Estalene
Bought by
Hermes Kathryn
Purchase Details
Closed on
Nov 30, 2009
Sold by
Howe Ronald and Howe Sarah
Bought by
Mills James A
Create a Home Valuation Report for This Property
The Home Valuation Report is an in-depth analysis detailing your home's value as well as a comparison with similar homes in the area
Home Values in the Area
Average Home Value in this Area
Purchase History
| Date | Buyer | Sale Price | Title Company |
|---|---|---|---|
| Kim Laura E | -- | None Available | |
| Kim Laura E | -- | None Available | |
| Hermes Kathryn | -- | None Available | |
| Hermes Kathryn | -- | None Available | |
| Mills James A | -- | Hlt | |
| Mills James A | -- | Hlt |
Source: Public Records
Mortgage History
| Date | Status | Borrower | Loan Amount |
|---|---|---|---|
| Open | Kim Laura E | $216,125 |
Source: Public Records
Tax History Compared to Growth
Tax History
| Year | Tax Paid | Tax Assessment Tax Assessment Total Assessment is a certain percentage of the fair market value that is determined by local assessors to be the total taxable value of land and additions on the property. | Land | Improvement |
|---|---|---|---|---|
| 2025 | $3,965 | $284,299 | $27,336 | $256,963 |
| 2024 | $3,965 | $290,905 | $45,281 | $264,058 |
| 2023 | $4,610 | $290,971 | $45,281 | $245,690 |
| 2022 | $4,710 | $240,417 | $37,312 | $203,105 |
| 2021 | $4,848 | $231,085 | $37,312 | $193,773 |
| 2020 | $4,959 | $231,765 | $37,312 | $194,453 |
| 2019 | $5,136 | $234,898 | $36,225 | $198,673 |
| 2018 | $4,756 | $218,657 | $36,225 | $182,432 |
| 2017 | $4,668 | $218,657 | $36,225 | $182,432 |
| 2016 | $4,466 | $209,188 | $36,225 | $172,963 |
| 2015 | $2,291 | $205,124 | $36,225 | $168,899 |
| 2014 | $2,291 | $193,318 | $36,225 | $157,093 |
Source: Public Records
Map
Nearby Homes
- 704 Paloma St
- 5106 Cloverdale Dr
- 802 Carriage Dr
- 601 Carriage Dr
- 842 Carriage Dr
- 709 Top Hill Dr
- 608 Top Hill Dr
- 717 Meadow Creek Dr
- 1107 Larkspur Ln
- 5401 Hollytree Dr
- 5401 Hollytree Dr Unit 1002
- 709 W Rieck Rd
- 1202 Rice Rd
- 7434 Waterview Square
- 6052 N Park Central Ct
- 5802 Briar Creek Dr
- 1408 Woodbridge Dr
- 418 Boyd Ln
- 1212 Parkview Dr
- 716 Chimney Rock Dr
- 702 702 Shiloh Ridge St
- 608 Shiloh Ridge St
- 608 608 Shiloh Ridge
- 704 Shiloh Ridge St
- 701 Paloma St
- 609 Paloma St
- 703 Paloma St
- 606 Shiloh Ridge St
- 606 606 Shiloh Ridge
- 706 Shiloh Ridge St
- 609 Shiloh Ridge St
- 607 Paloma St
- 705 705 Paloma St
- 607 607 Paloma
- 701 Shiloh Ridge St
- 609 609 Shiloh Ridge
- 607 Shiloh Ridge St
- 703 Shiloh Ridge St
- 604 Shiloh Ridge St
- 604 604 Shiloh Ridge