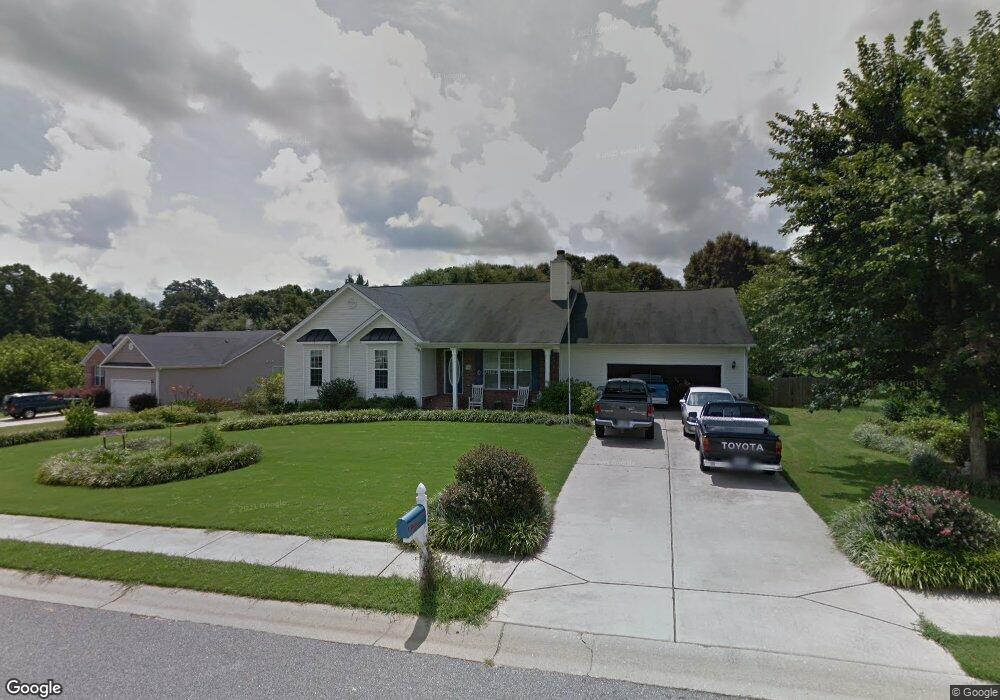
702 Silver Bell Rd Unit 37 Jefferson, GA 30549
Estimated Value: $385,987 - $413,000
4
Beds
3
Baths
2,169
Sq Ft
$181/Sq Ft
Est. Value
About This Home
This home is located at 702 Silver Bell Rd Unit 37, Jefferson, GA 30549 and is currently estimated at $393,497, approximately $181 per square foot. 702 Silver Bell Rd Unit 37 is a home located in Jackson County with nearby schools including Jefferson Elementary School, Jefferson Academy, and Jefferson Middle School.
Ownership History
Date
Name
Owned For
Owner Type
Purchase Details
Closed on
Oct 12, 2021
Sold by
Lacy Michael S
Bought by
Swink Christopher D and Swink Stephanie Kathleen
Current Estimated Value
Purchase Details
Closed on
Mar 10, 2006
Sold by
Not Provided
Bought by
Lacy Michael S and Lacy Deborah J
Home Financials for this Owner
Home Financials are based on the most recent Mortgage that was taken out on this home.
Original Mortgage
$99,850
Interest Rate
6.19%
Mortgage Type
FHA
Purchase Details
Closed on
Jul 28, 2005
Sold by
Galaxy Development Llc
Bought by
Star Home Builders Inc
Purchase Details
Closed on
Jun 14, 2005
Sold by
Galaxy Development Llc
Bought by
Star Home Builders Inc
Create a Home Valuation Report for This Property
The Home Valuation Report is an in-depth analysis detailing your home's value as well as a comparison with similar homes in the area
Home Values in the Area
Average Home Value in this Area
Purchase History
| Date | Buyer | Sale Price | Title Company |
|---|---|---|---|
| Swink Christopher D | $360,000 | -- | |
| Lacy Michael S | $190,900 | -- | |
| Star Home Builders Inc | $280,000 | -- | |
| Star Home Builders Inc | $40,000 | -- |
Source: Public Records
Mortgage History
| Date | Status | Borrower | Loan Amount |
|---|---|---|---|
| Previous Owner | Lacy Michael S | $99,850 |
Source: Public Records
Tax History Compared to Growth
Tax History
| Year | Tax Paid | Tax Assessment Tax Assessment Total Assessment is a certain percentage of the fair market value that is determined by local assessors to be the total taxable value of land and additions on the property. | Land | Improvement |
|---|---|---|---|---|
| 2024 | $3,458 | $125,440 | $25,000 | $100,440 |
| 2023 | $3,458 | $114,800 | $25,000 | $89,800 |
| 2022 | $3,146 | $97,880 | $25,000 | $72,880 |
| 2021 | $3,037 | $90,880 | $18,000 | $72,880 |
| 2020 | $2,729 | $78,480 | $18,000 | $60,480 |
| 2019 | $2,599 | $73,680 | $13,200 | $60,480 |
| 2018 | $2,693 | $75,760 | $13,200 | $62,560 |
| 2017 | $2,515 | $69,365 | $13,200 | $56,165 |
| 2016 | $2,527 | $69,365 | $13,200 | $56,165 |
| 2015 | $2,434 | $66,565 | $10,400 | $56,165 |
| 2014 | $1,876 | $50,966 | $10,400 | $40,566 |
| 2013 | -- | $50,965 | $10,400 | $40,565 |
Source: Public Records
Map
Nearby Homes
- 345 Hickory Hills Dr
- 273 Hickory Hills Dr
- 176 Village Dr
- 750 Jett Roberts Rd
- 17 Castleview Ct
- 194 Georgia 82 N
- 955 Georgia 82 N
- Tract 1 Georgia 82 N
- 1945 Georgia 82 N
- 1681 Jett Roberts Rd
- 352 Lakeshore Dr
- 1817 Jett Roberts Rd
- 1841 Jett Roberts Rd
- 222 Jett Roberts Rd
- 1354 Washington St
- 865 Elder Dr
- 206 Blue Dragon Dr
- 41 Melivy Ct
- 430 Katherine Dr
- 702 Silver Bell Rd
- 680 Silver Bell Rd
- 703 Silver Bell Rd
- 658 Silver Bell Rd
- 726 Silver Bell Rd
- 729 Silver Bell Rd
- 659 Silver Bell Rd
- 628 Silver Bell Rd
- 631 Silver Bell Rd
- 211 Persimmon Dr
- 586 Silver Bell Rd
- 451 Hickory Hills Dr
- 195 Persimmon Dr
- 555 Silver Bell Rd
- 574 Silver Bell Rd
- 161 Persimmon Dr
- 560 Silver Bell Rd
- 142 Persimmon Dr