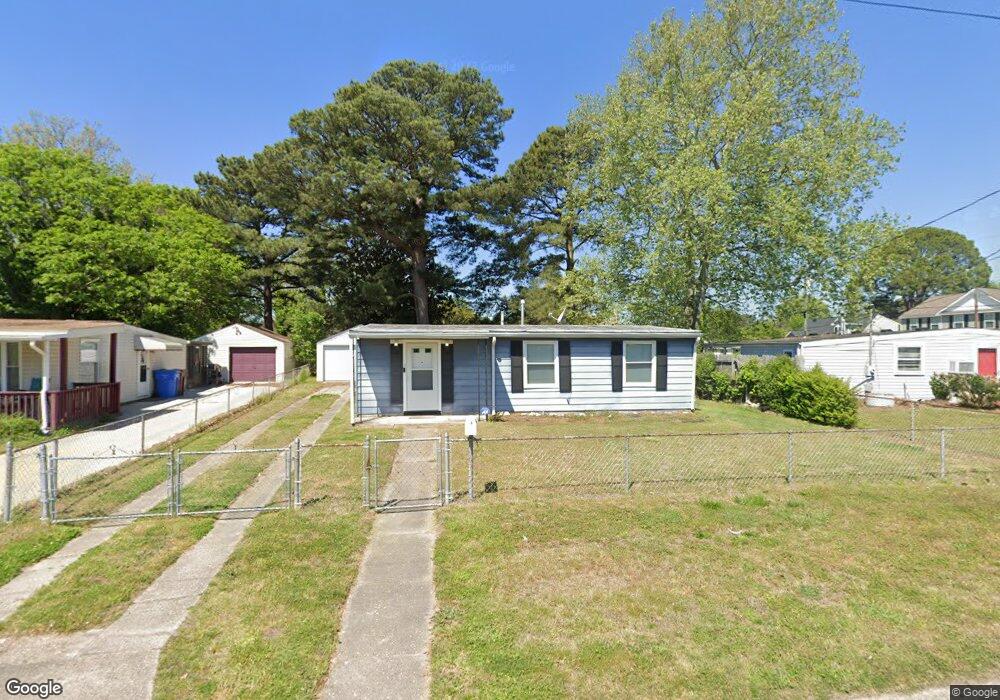
702 Stalham Rd Chesapeake, VA 23325
Indian River NeighborhoodEstimated Value: $201,000 - $261,105
3
Beds
1
Bath
875
Sq Ft
$263/Sq Ft
Est. Value
About This Home
This home is located at 702 Stalham Rd, Chesapeake, VA 23325 and is currently estimated at $230,276, approximately $263 per square foot. 702 Stalham Rd is a home located in Chesapeake City with nearby schools including Thurgood Marshall Elementary School, Indian River Middle, and Indian River High.
Ownership History
Date
Name
Owned For
Owner Type
Purchase Details
Closed on
Dec 30, 2020
Sold by
Porter Garnett and Porter Donna Y
Bought by
Lopez Rosaura Hernandez
Current Estimated Value
Home Financials for this Owner
Home Financials are based on the most recent Mortgage that was taken out on this home.
Original Mortgage
$127,645
Outstanding Balance
$113,904
Interest Rate
2.7%
Mortgage Type
New Conventional
Estimated Equity
$116,372
Purchase Details
Closed on
Apr 2, 2020
Sold by
Porter Garnett E
Bought by
Porter Garnett and Porter Donna Y
Create a Home Valuation Report for This Property
The Home Valuation Report is an in-depth analysis detailing your home's value as well as a comparison with similar homes in the area
Home Values in the Area
Average Home Value in this Area
Purchase History
| Date | Buyer | Sale Price | Title Company |
|---|---|---|---|
| Lopez Rosaura Hernandez | $130,000 | Noble Title & Escrow | |
| Porter Garnett | -- | None Available |
Source: Public Records
Mortgage History
| Date | Status | Borrower | Loan Amount |
|---|---|---|---|
| Open | Lopez Rosaura Hernandez | $127,645 |
Source: Public Records
Tax History
| Year | Tax Paid | Tax Assessment Tax Assessment Total Assessment is a certain percentage of the fair market value that is determined by local assessors to be the total taxable value of land and additions on the property. | Land | Improvement |
|---|---|---|---|---|
| 2025 | $1,931 | $205,800 | $100,000 | $105,800 |
| 2024 | $1,931 | $191,200 | $90,000 | $101,200 |
| 2023 | $1,560 | $177,000 | $80,000 | $97,000 |
| 2022 | $1,518 | $150,300 | $65,000 | $85,300 |
| 2021 | $1,415 | $134,800 | $55,000 | $79,800 |
| 2020 | $1,199 | $114,200 | $55,000 | $59,200 |
| 2019 | $1,172 | $111,600 | $55,000 | $56,600 |
| 2018 | $1,176 | $112,000 | $50,000 | $62,000 |
| 2017 | $1,140 | $108,600 | $50,000 | $58,600 |
| 2016 | $1,122 | $106,900 | $50,000 | $56,900 |
| 2015 | $1,111 | $105,800 | $50,000 | $55,800 |
| 2014 | $999 | $95,100 | $50,000 | $45,100 |
Source: Public Records
Map
Nearby Homes
Your Personal Tour Guide
Ask me questions while you tour the home.