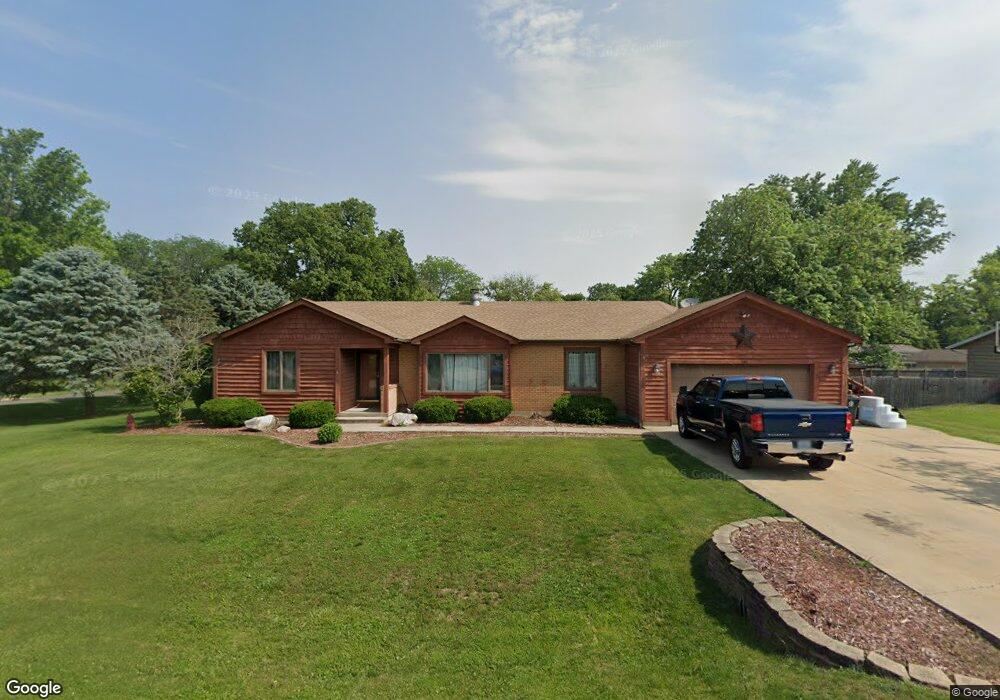
702 W Grant St Sheridan, IL 60551
Estimated Value: $297,899 - $348,000
3
Beds
4
Baths
1,600
Sq Ft
$201/Sq Ft
Est. Value
About This Home
This home is located at 702 W Grant St, Sheridan, IL 60551 and is currently estimated at $321,975, approximately $201 per square foot. 702 W Grant St is a home located in LaSalle County with nearby schools including Serena High School and Sheridan Sda Elementary School.
Ownership History
Date
Name
Owned For
Owner Type
Purchase Details
Closed on
Feb 29, 2020
Sold by
Dunaway Nathan and Dunaway Jennifer
Bought by
Heidelmeier John and Sebby Heather Michelle
Current Estimated Value
Home Financials for this Owner
Home Financials are based on the most recent Mortgage that was taken out on this home.
Original Mortgage
$189,000
Outstanding Balance
$168,570
Interest Rate
3.88%
Mortgage Type
New Conventional
Estimated Equity
$153,405
Purchase Details
Closed on
Apr 21, 2005
Sold by
Pargon Relocation Resources Inc
Bought by
Dunaway Nathan and Dunaway Jennifer
Purchase Details
Closed on
Jan 22, 2005
Sold by
Wampler James D and Wampler Bethney A
Bought by
Paragon Relocation Resources Inc
Create a Home Valuation Report for This Property
The Home Valuation Report is an in-depth analysis detailing your home's value as well as a comparison with similar homes in the area
Home Values in the Area
Average Home Value in this Area
Purchase History
| Date | Buyer | Sale Price | Title Company |
|---|---|---|---|
| Heidelmeier John | $210,000 | Chicago Title | |
| Dunaway Nathan | $200,000 | First American Title | |
| Paragon Relocation Resources Inc | $200,000 | First American Title |
Source: Public Records
Mortgage History
| Date | Status | Borrower | Loan Amount |
|---|---|---|---|
| Open | Heidelmeier John | $189,000 | |
| Closed | Dunaway Nathan | $0 |
Source: Public Records
Tax History Compared to Growth
Tax History
| Year | Tax Paid | Tax Assessment Tax Assessment Total Assessment is a certain percentage of the fair market value that is determined by local assessors to be the total taxable value of land and additions on the property. | Land | Improvement |
|---|---|---|---|---|
| 2024 | $6,218 | $89,785 | $6,753 | $83,032 |
| 2023 | $6,080 | $84,352 | $6,344 | $78,008 |
| 2022 | $5,741 | $76,537 | $5,756 | $70,781 |
| 2021 | $5,469 | $71,705 | $5,393 | $66,312 |
| 2020 | $5,750 | $69,107 | $5,198 | $63,909 |
| 2019 | $5,465 | $66,411 | $4,995 | $61,416 |
| 2018 | $5,024 | $66,040 | $4,736 | $61,304 |
| 2017 | $4,697 | $61,980 | $7,102 | $54,878 |
| 2016 | $4,699 | $62,073 | $7,113 | $54,960 |
| 2015 | $5,037 | $64,098 | $7,345 | $56,753 |
| 2012 | -- | $65,417 | $7,496 | $57,921 |
Source: Public Records
Map
Nearby Homes
- 305 W Park St
- 2469 N 41st Rd
- 4141 E 2603rd Rd
- 2427 N 42nd Rd
- 2446 N 4210th Rd
- 2444 N 4210th Rd
- 2440 N 4210th Rd
- 2455 N 4220th Rd
- 2447 N 4220th Rd
- 2443 N 4210th Rd
- 2434 N 4220th Rd
- 2432 N 4210th Rd
- 2428 N 4210th Rd
- 2790 N 4201st Rd
- 2426 N 4220th Rd
- 2420 N 4210th Rd
- 2422 N 4220th Rd
- 2419 N 4210th Rd
- 2411 N 4220th Rd
- 2407 N 4220th Rd
- 700 W Grant St
- 735 W Pleasant Ave
- 725 W Pleasant Ave
- 400 S Prairie St
- 325 S Prairie St
- 715 W Pleasant St
- 701 W Grant St
- 805 W Pleasant Ave
- 801 W Grant St
- 460 S Prairie St
- 720 W Pleasant St
- 600 W Grant St
- 710 W Pleasant St
- 625 W Pleasant St
- 835 W Pleasant Ave
- 835 W Grant St
- 800 W Pleasant Ave
- 830 W Pleasant St
- 600 W Pleasant St
- 745 W Church St