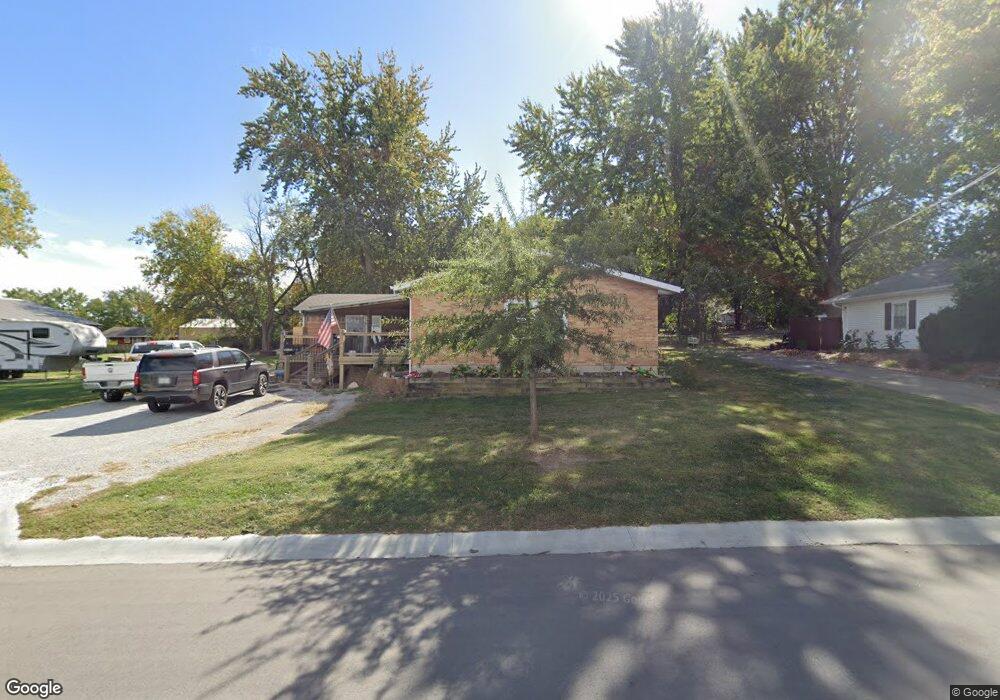
702 W Main St Odessa, MO 64076
Estimated Value: $265,000 - $299,000
4
Beds
2
Baths
2,116
Sq Ft
$130/Sq Ft
Est. Value
About This Home
This home is located at 702 W Main St, Odessa, MO 64076 and is currently estimated at $274,837, approximately $129 per square foot. 702 W Main St is a home with nearby schools including McQuerry Elementary School, Odessa Upper Elementary School, and Odessa Middle School.
Ownership History
Date
Name
Owned For
Owner Type
Purchase Details
Closed on
Sep 29, 2025
Sold by
Palmer Tina P and Peerson Tina
Bought by
Peerson Tina and Peerson Bruce
Current Estimated Value
Home Financials for this Owner
Home Financials are based on the most recent Mortgage that was taken out on this home.
Original Mortgage
$174,731
Outstanding Balance
$174,731
Interest Rate
6.58%
Mortgage Type
New Conventional
Estimated Equity
$100,106
Purchase Details
Closed on
Apr 25, 2007
Sold by
Palmer D F
Bought by
Palmer Tina P and Palmer D
Create a Home Valuation Report for This Property
The Home Valuation Report is an in-depth analysis detailing your home's value as well as a comparison with similar homes in the area
Home Values in the Area
Average Home Value in this Area
Purchase History
| Date | Buyer | Sale Price | Title Company |
|---|---|---|---|
| Peerson Tina | -- | Alliance Nationwide Title Agen | |
| Palmer Tina P | -- | -- |
Source: Public Records
Mortgage History
| Date | Status | Borrower | Loan Amount |
|---|---|---|---|
| Open | Peerson Tina | $174,731 |
Source: Public Records
Tax History Compared to Growth
Tax History
| Year | Tax Paid | Tax Assessment Tax Assessment Total Assessment is a certain percentage of the fair market value that is determined by local assessors to be the total taxable value of land and additions on the property. | Land | Improvement |
|---|---|---|---|---|
| 2025 | $1,434 | $21,594 | $0 | $0 |
| 2024 | $1,434 | $18,942 | $0 | $0 |
| 2023 | $1,432 | $18,942 | $0 | $0 |
| 2022 | $1,417 | $18,942 | $0 | $0 |
| 2021 | $1,414 | $18,942 | $0 | $0 |
| 2020 | $1,414 | $18,810 | $0 | $0 |
| 2019 | $1,411 | $18,810 | $0 | $0 |
| 2018 | $1,298 | $18,810 | $0 | $0 |
| 2017 | $1,298 | $18,810 | $0 | $0 |
| 2016 | $1,152 | $83,170 | $13,900 | $69,270 |
| 2012 | -- | $82,330 | $13,900 | $68,430 |
Source: Public Records
Map
Nearby Homes