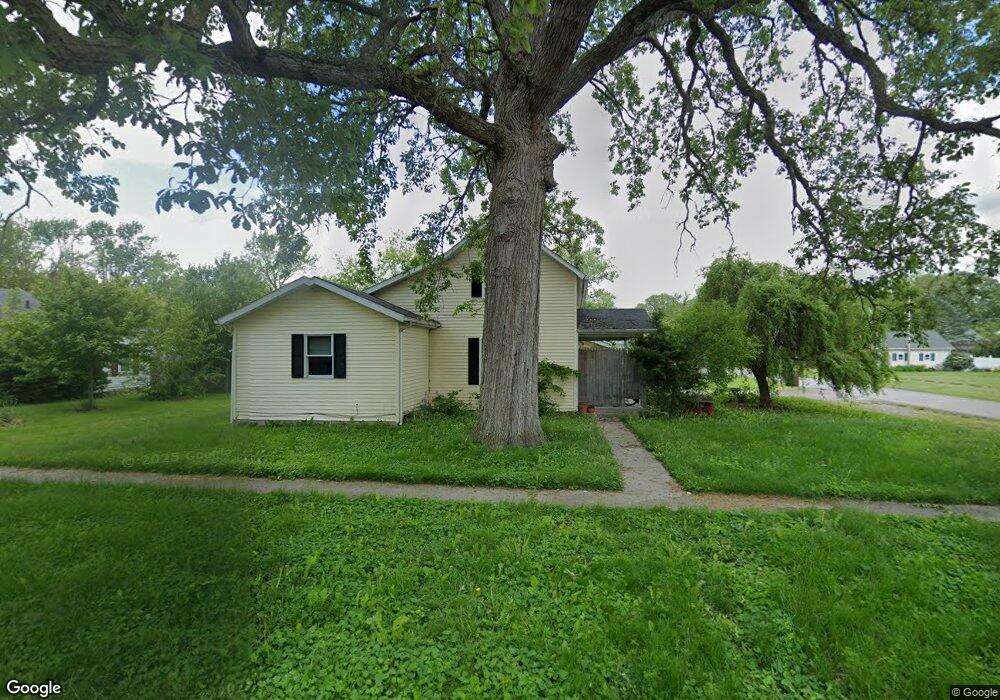
702 W Perry St Paulding, OH 45879
Estimated Value: $91,000 - $135,000
3
Beds
2
Baths
1,346
Sq Ft
$86/Sq Ft
Est. Value
About This Home
This home is located at 702 W Perry St, Paulding, OH 45879 and is currently estimated at $115,568, approximately $85 per square foot. 702 W Perry St is a home located in Paulding County with nearby schools including Paulding High School.
Ownership History
Date
Name
Owned For
Owner Type
Purchase Details
Closed on
May 26, 2010
Sold by
True Grit Llc
Bought by
Sizemore Ann M
Current Estimated Value
Home Financials for this Owner
Home Financials are based on the most recent Mortgage that was taken out on this home.
Original Mortgage
$61,447
Outstanding Balance
$43,910
Interest Rate
4.97%
Mortgage Type
Purchase Money Mortgage
Estimated Equity
$71,658
Purchase Details
Closed on
Feb 10, 2009
Sold by
Bandy Erwin J and Bandy Sawnda S
Bought by
True Grit Llc
Purchase Details
Closed on
Apr 28, 2008
Sold by
Keezer Rex A and United States Department Of Ag
Bought by
Bandy Saundra S
Home Financials for this Owner
Home Financials are based on the most recent Mortgage that was taken out on this home.
Original Mortgage
$27,000
Interest Rate
5.88%
Mortgage Type
Future Advance Clause Open End Mortgage
Purchase Details
Closed on
Sep 22, 2003
Sold by
Grubb Michael
Bought by
Sizemore Ann M
Purchase Details
Closed on
Jul 11, 1997
Bought by
Sizemore Ann M
Create a Home Valuation Report for This Property
The Home Valuation Report is an in-depth analysis detailing your home's value as well as a comparison with similar homes in the area
Home Values in the Area
Average Home Value in this Area
Purchase History
| Date | Buyer | Sale Price | Title Company |
|---|---|---|---|
| Sizemore Ann M | $61,000 | None Available | |
| True Grit Llc | -- | None Available | |
| Bandy Saundra S | $30,000 | None Available | |
| Sizemore Ann M | $13,000 | -- | |
| Sizemore Ann M | $7,800 | -- |
Source: Public Records
Mortgage History
| Date | Status | Borrower | Loan Amount |
|---|---|---|---|
| Open | Sizemore Ann M | $61,447 | |
| Previous Owner | Bandy Saundra S | $27,000 |
Source: Public Records
Tax History
| Year | Tax Paid | Tax Assessment Tax Assessment Total Assessment is a certain percentage of the fair market value that is determined by local assessors to be the total taxable value of land and additions on the property. | Land | Improvement |
|---|---|---|---|---|
| 2025 | $1,530 | $35,360 | $5,990 | $29,370 |
| 2024 | $1,530 | $28,740 | $4,870 | $23,870 |
| 2023 | $1,292 | $28,740 | $4,870 | $23,870 |
| 2022 | $1,252 | $28,740 | $4,870 | $23,870 |
| 2021 | $1,049 | $21,430 | $4,380 | $17,050 |
| 2020 | $938 | $21,430 | $4,380 | $17,050 |
| 2019 | $945 | $19,890 | $4,380 | $15,510 |
| 2018 | $893 | $19,890 | $4,380 | $15,510 |
| 2017 | $894 | $19,890 | $4,380 | $15,510 |
| 2016 | $894 | $19,890 | $4,380 | $15,510 |
| 2015 | $823 | $18,590 | $4,380 | $14,210 |
| 2014 | $819 | $18,590 | $4,380 | $14,210 |
| 2013 | $922 | $19,330 | $4,380 | $14,950 |
Source: Public Records
Map
Nearby Homes
- 708 W Perry St
- 703 W Jackson St
- 709 W Jackson St
- 714 W Perry St
- 703 W Perry St
- 616 W Perry St
- 715 W Jackson St
- 621 W Jackson St
- 720 W Perry St
- 709 W Perry St
- 621 W Perry St
- 715 W Perry St
- 615 W Jackson St
- 721 W Jackson St
- 610 W Perry St
- 721 W Perry St
- 114 S Dewitt St
- 602 W Perry St
- 609 W Perry St
- 120 N Dix St
Your Personal Tour Guide
Ask me questions while you tour the home.