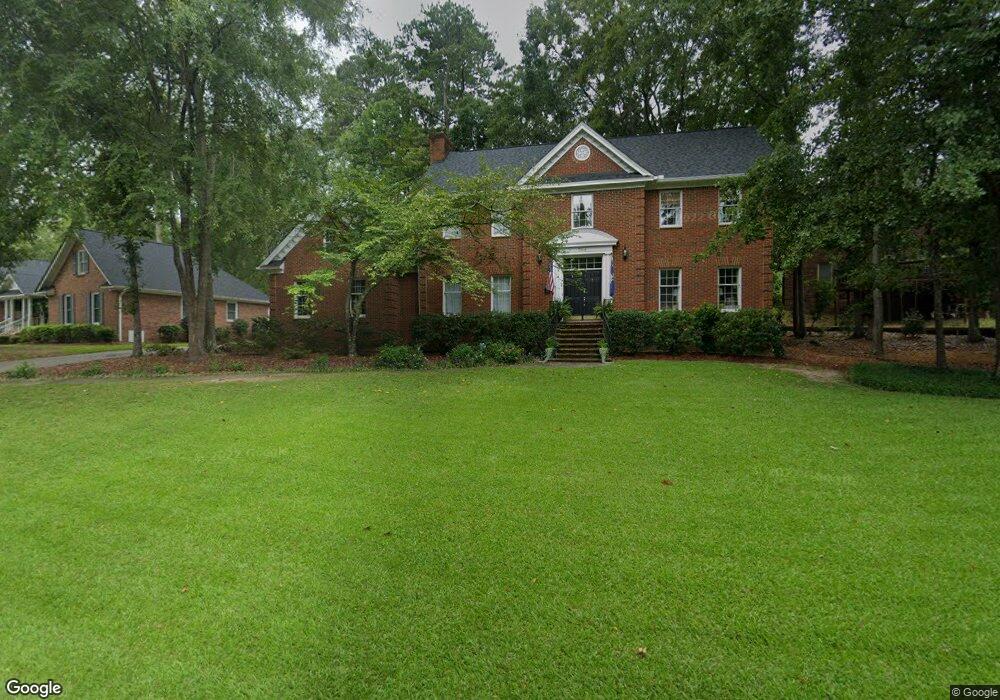
702 Woodcreek Ct Columbia, SC 29212
Northwest Columbia NeighborhoodEstimated Value: $368,000 - $402,530
4
Beds
4
Baths
3,371
Sq Ft
$115/Sq Ft
Est. Value
About This Home
This home is located at 702 Woodcreek Ct, Columbia, SC 29212 and is currently estimated at $388,133, approximately $115 per square foot. 702 Woodcreek Ct is a home located in Lexington County with nearby schools including Harbison West Elementary School, Irmo Middle, and Irmo High.
Ownership History
Date
Name
Owned For
Owner Type
Purchase Details
Closed on
Jul 22, 2016
Sold by
National Transfer Services Llc
Bought by
Sweigart Shawn P and Sweigart Kayla M
Current Estimated Value
Home Financials for this Owner
Home Financials are based on the most recent Mortgage that was taken out on this home.
Original Mortgage
$168,000
Interest Rate
4.16%
Mortgage Type
New Conventional
Purchase Details
Closed on
May 18, 2016
Sold by
Lowe Grant L
Bought by
National Transfer Services Llc
Purchase Details
Closed on
May 3, 2011
Sold by
Lowe Adrienne T and Shaw Adrienne
Bought by
Lowe Grant L
Purchase Details
Closed on
Aug 25, 2008
Sold by
King William Dennis and King Ann T
Bought by
Lowe Grant L and Lowe Adrienne T
Home Financials for this Owner
Home Financials are based on the most recent Mortgage that was taken out on this home.
Original Mortgage
$263,400
Interest Rate
6.21%
Mortgage Type
VA
Create a Home Valuation Report for This Property
The Home Valuation Report is an in-depth analysis detailing your home's value as well as a comparison with similar homes in the area
Home Values in the Area
Average Home Value in this Area
Purchase History
| Date | Buyer | Sale Price | Title Company |
|---|---|---|---|
| Sweigart Shawn P | $210,000 | None Available | |
| National Transfer Services Llc | $259,900 | None Available | |
| Lowe Grant L | -- | -- | |
| Lowe Grant L | $255,000 | -- |
Source: Public Records
Mortgage History
| Date | Status | Borrower | Loan Amount |
|---|---|---|---|
| Previous Owner | Sweigart Shawn P | $168,000 | |
| Previous Owner | Lowe Grant L | $263,400 |
Source: Public Records
Tax History Compared to Growth
Tax History
| Year | Tax Paid | Tax Assessment Tax Assessment Total Assessment is a certain percentage of the fair market value that is determined by local assessors to be the total taxable value of land and additions on the property. | Land | Improvement |
|---|---|---|---|---|
| 2024 | $2,008 | $9,982 | $1,516 | $8,466 |
| 2023 | $1,876 | $9,982 | $1,516 | $8,466 |
| 2022 | $1,861 | $9,982 | $1,516 | $8,466 |
| 2020 | $1,881 | $9,982 | $1,516 | $8,466 |
| 2019 | $1,668 | $8,680 | $1,400 | $7,280 |
| 2018 | $1,477 | $8,680 | $1,400 | $7,280 |
| 2017 | $1,413 | $10,360 | $1,400 | $8,960 |
| 2016 | $1,550 | $9,383 | $1,400 | $7,983 |
| 2015 | $1,490 | $9,383 | $1,400 | $7,983 |
| 2014 | $1,490 | $10,137 | $1,400 | $8,737 |
| 2013 | -- | $10,140 | $1,400 | $8,740 |
Source: Public Records
Map
Nearby Homes
- 102 Tuscany Ct
- 302 Longbow Ct
- Briarwood II Plan at Bickley Station
- Glenwood II Plan at Bickley Station
- Driftwood II Plan at Bickley Station
- 108 Locomotive (Lot 02) Ln
- 119 Locomotive Ln
- 119 Ln
- 112 Locomotive (Lot 03) Ln
- 116 Locomotive (Lot 04) Ln
- 124 Locomotive (Lot 06) Ln
- 120 Locomotive (Lot 05) Ln
- 128 Ln
- 101, 119 & 125 Lake Murray Blvd
- 18 Paddock Chase
- 306 Timberhill Ct
- 167 Locomotive (Lot 21) Ln
- 306 Conductor Ln
- 171 Locomotive (Lot 22) Ln
- 306 Conductor (Lot 60) Ln
- 700 Woodcreek Ct
- 704 Woodcreek Ct
- 710 Archers Ln
- 707 Woodcreek Ct
- 705 Woodcreek Ct
- 709 Woodcreek Ct
- 708 Archers Ln
- 706 Woodcreek Ct
- 703 Woodcreek Ct
- 701 Woodcreek Ct
- 706 Archers Ln
- 701 Highpoint Ct
- 700 Highpoint Ct
- 708 Woodcreek Ct
- 702 Highpoint Ct
- 713 Woodcreek Ct
- 704 Archers Ln
- 703 Highpoint Ct
- 600 Valleywood Ct
- 704 Highpoint Ct