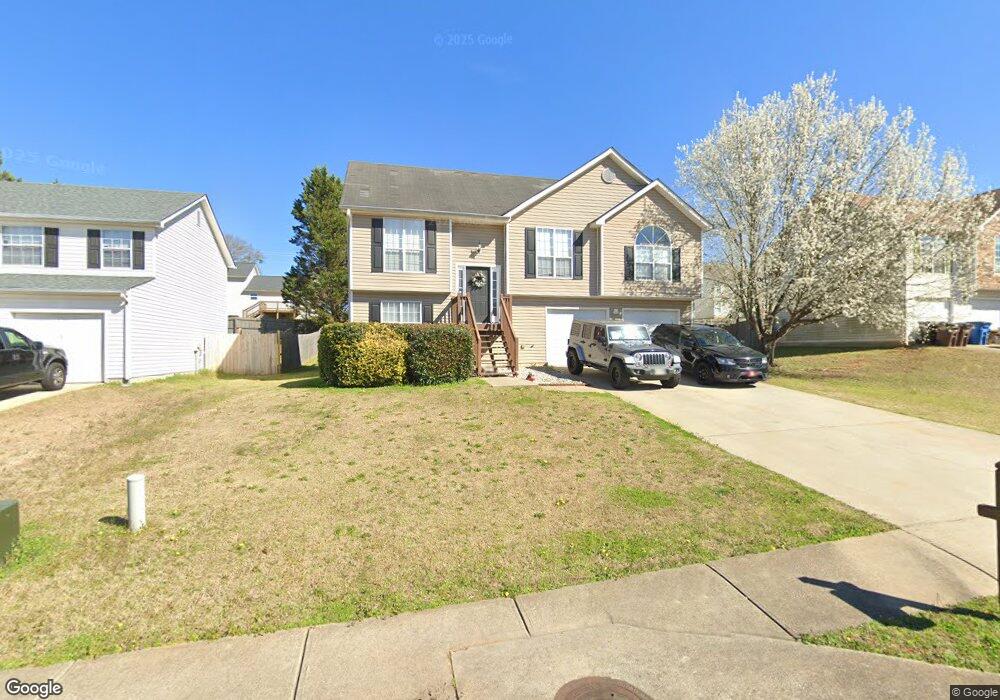
7020 Regency Ln McDonough, GA 30253
Estimated Value: $284,457 - $316,000
5
Beds
3
Baths
1,791
Sq Ft
$165/Sq Ft
Est. Value
About This Home
This home is located at 7020 Regency Ln, McDonough, GA 30253 and is currently estimated at $295,864, approximately $165 per square foot. 7020 Regency Ln is a home located in Henry County with nearby schools including Walnut Creek Elementary School, McDonough Middle School, and Hickory Flat Elementary School.
Ownership History
Date
Name
Owned For
Owner Type
Purchase Details
Closed on
Jul 7, 2015
Sold by
Welman Keith
Bought by
Aerican Homes 4 Rent Properties Eight Ll
Current Estimated Value
Purchase Details
Closed on
Jun 24, 2014
Sold by
1Home2go Llc
Bought by
Wellman Keith
Purchase Details
Closed on
Mar 30, 2006
Sold by
Turner Timothy and Turner Francie
Bought by
Wellman Keith and Lindsey Yakiah
Home Financials for this Owner
Home Financials are based on the most recent Mortgage that was taken out on this home.
Original Mortgage
$115,200
Interest Rate
6.23%
Mortgage Type
New Conventional
Purchase Details
Closed on
Jun 29, 2000
Sold by
M & M Homes
Bought by
Turner Timothy and Turner Francie
Home Financials for this Owner
Home Financials are based on the most recent Mortgage that was taken out on this home.
Original Mortgage
$116,300
Interest Rate
8.63%
Mortgage Type
New Conventional
Create a Home Valuation Report for This Property
The Home Valuation Report is an in-depth analysis detailing your home's value as well as a comparison with similar homes in the area
Home Values in the Area
Average Home Value in this Area
Purchase History
| Date | Buyer | Sale Price | Title Company |
|---|---|---|---|
| Aerican Homes 4 Rent Properties Eight Ll | $105,000 | -- | |
| Wellman Keith | -- | -- | |
| Wellman Keith | $144,000 | -- | |
| Turner Timothy | $119,900 | -- |
Source: Public Records
Mortgage History
| Date | Status | Borrower | Loan Amount |
|---|---|---|---|
| Previous Owner | Wellman Keith | $115,200 | |
| Previous Owner | Turner Timothy | $116,300 |
Source: Public Records
Tax History Compared to Growth
Tax History
| Year | Tax Paid | Tax Assessment Tax Assessment Total Assessment is a certain percentage of the fair market value that is determined by local assessors to be the total taxable value of land and additions on the property. | Land | Improvement |
|---|---|---|---|---|
| 2025 | $4,652 | $124,840 | $14,000 | $110,840 |
| 2024 | $4,652 | $112,480 | $14,000 | $98,480 |
| 2023 | $4,126 | $110,000 | $11,200 | $98,800 |
| 2022 | $3,411 | $88,800 | $11,200 | $77,600 |
| 2021 | $2,734 | $69,600 | $11,200 | $58,400 |
| 2020 | $2,542 | $64,320 | $10,000 | $54,320 |
| 2019 | $2,397 | $58,880 | $10,000 | $48,880 |
| 2018 | $1,829 | $52,600 | $8,000 | $44,600 |
| 2016 | $1,739 | $42,000 | $6,468 | $35,532 |
| 2015 | $1,831 | $42,560 | $7,200 | $35,360 |
| 2014 | $1,585 | $37,400 | $6,000 | $31,400 |
Source: Public Records
Map
Nearby Homes
- 7000 Regency Ln
- 7011 Regency Ln
- 4170 Monarch Dr
- 7030 Kingston Ln
- 90 Cabriolet Trail
- 271 Spring Creek Blvd
- 121 Pinnacle Ln
- 1244 Faye Ct
- 204 Rankin Cir
- 415 Gracious Way
- 360 Atlanta St
- 101 Pinnacle Ln
- 0 Ivey Edwards Ln Unit 10409448
- 0 Ivey Edwards Ln Unit 10246400
- 224 Prominent Loop
- 409 Hyder Ct
- 117 Tracy Ln
- 297 Decatur Rd
- 280 Burke Cir
- 685 Highway 155 N
- 7010 Regency Ln
- 7030 Regency Ln
- 0 Regency Ln Unit 7375660
- 0 Regency Ln Unit 8085507
- 4181 Monarch Dr
- 4191 Monarch Dr
- 4171 Monarch Dr
- 7040 Regency Ln
- 7021 Regency Ln
- 7031 Regency Ln Unit 134
- 7031 Regency Ln
- 5001 Monarch Dr
- 4161 Monarch Dr
- 7001 Regency Ln
- 7041 Regency Ln
- 7050 Regency Ln
- 5011 Monarch Dr
- 3021 Century Ln
- 4190 Monarch Dr
- 4180 Monarch Dr