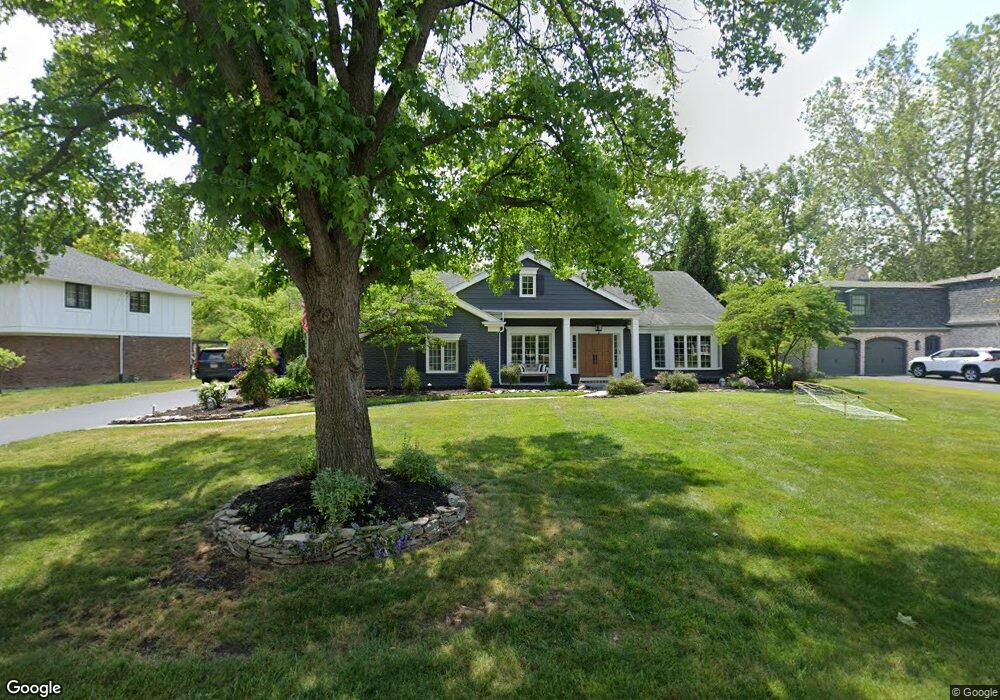
7021 Applecreek Rd Sylvania, OH 43560
Estimated Value: $452,431 - $493,000
4
Beds
3
Baths
3,718
Sq Ft
$126/Sq Ft
Est. Value
About This Home
This home is located at 7021 Applecreek Rd, Sylvania, OH 43560 and is currently estimated at $469,358, approximately $126 per square foot. 7021 Applecreek Rd is a home located in Lucas County with nearby schools including Maplewood Elementary School, Sylvania Arbor Hills Junior High School, and Sylvania Northview High School.
Ownership History
Date
Name
Owned For
Owner Type
Purchase Details
Closed on
Dec 9, 2020
Sold by
Cary Floyd B
Bought by
Patricia L Cary
Current Estimated Value
Home Financials for this Owner
Home Financials are based on the most recent Mortgage that was taken out on this home.
Original Mortgage
$337,500
Outstanding Balance
$301,011
Interest Rate
2.8%
Mortgage Type
New Conventional
Estimated Equity
$168,347
Purchase Details
Closed on
Dec 4, 2020
Sold by
Cary Patricia L
Bought by
Rennels Matthew L and Rennels Chelsea L
Home Financials for this Owner
Home Financials are based on the most recent Mortgage that was taken out on this home.
Original Mortgage
$337,500
Outstanding Balance
$301,011
Interest Rate
2.8%
Mortgage Type
New Conventional
Estimated Equity
$168,347
Purchase Details
Closed on
Nov 15, 1999
Sold by
Zahn Gretchen E
Bought by
Cary Floyd B and Cary Patricia L
Home Financials for this Owner
Home Financials are based on the most recent Mortgage that was taken out on this home.
Original Mortgage
$100,000
Interest Rate
7.72%
Create a Home Valuation Report for This Property
The Home Valuation Report is an in-depth analysis detailing your home's value as well as a comparison with similar homes in the area
Home Values in the Area
Average Home Value in this Area
Purchase History
| Date | Buyer | Sale Price | Title Company |
|---|---|---|---|
| Patricia L Cary | -- | -- | |
| Rennels Matthew L | $375,000 | None Available | |
| Cary Floyd B | $305,000 | Northwest Title Agency Of Oh |
Source: Public Records
Mortgage History
| Date | Status | Borrower | Loan Amount |
|---|---|---|---|
| Open | Rennels Matthew L | $337,500 | |
| Previous Owner | Cary Floyd B | $100,000 |
Source: Public Records
Tax History Compared to Growth
Tax History
| Year | Tax Paid | Tax Assessment Tax Assessment Total Assessment is a certain percentage of the fair market value that is determined by local assessors to be the total taxable value of land and additions on the property. | Land | Improvement |
|---|---|---|---|---|
| 2024 | $4,361 | $138,320 | $16,555 | $121,765 |
| 2023 | $8,108 | $112,000 | $14,735 | $97,265 |
| 2022 | $8,120 | $112,000 | $14,735 | $97,265 |
| 2021 | $7,700 | $112,000 | $14,735 | $97,265 |
| 2020 | $7,527 | $96,530 | $10,150 | $86,380 |
| 2019 | $7,247 | $96,530 | $10,150 | $86,380 |
| 2018 | $7,187 | $96,530 | $10,150 | $86,380 |
| 2017 | $7,718 | $94,325 | $9,905 | $84,420 |
| 2016 | $7,567 | $269,500 | $28,300 | $241,200 |
| 2015 | $7,127 | $269,500 | $28,300 | $241,200 |
| 2014 | $6,478 | $90,690 | $9,520 | $81,170 |
| 2013 | $6,478 | $90,690 | $9,520 | $81,170 |
Source: Public Records
Map
Nearby Homes
- 7030 Hickory Ridge Rd
- 6023 Brainard Dr
- 6046 Gillingham Dr
- 5144 Franciscan Blvd
- 6053 Gregory Dr
- 7120 Grenlock Dr
- 6641 Convent Blvd
- 5310 Turnberry Ln
- 9152 Mill St
- 6584 Brint Rd
- 20 Main Street Cir
- 4850 Tamworth Rd
- 6835 Brintwood Rd
- 4814 Sylvan Ct
- 7345 Country Commons Ln
- 6409 Madison Cove Ct Unit 3
- 7839 Hedingham Rd
- 6922 Gettysburg Dr
- 6047 Peppermill Dr
- 7858 Erie St
- 7011 Applecreek Rd
- 7031 Applecreek Rd
- 7001 Apple Creek Rd
- 7001 Applecreek Rd
- 7041 Applecreek Rd
- 7041 Apple Creek Rd
- 7024 Applecreek Rd
- 7016 Applecreek Rd
- 7034 Applecreek Rd
- 7042 Apple Creek Rd
- 7006 Applecreek Rd
- 6957 Applecreek Rd
- 7051 Applecreek Rd
- 7042 Applecreek Rd
- 5634 Bent Oak Rd
- 6966 Apple Creek Rd
- 6966 Applecreek Rd
- 5624 Bent Oak Rd
- 7052 Apple Creek Rd
- 7052 Applecreek Rd