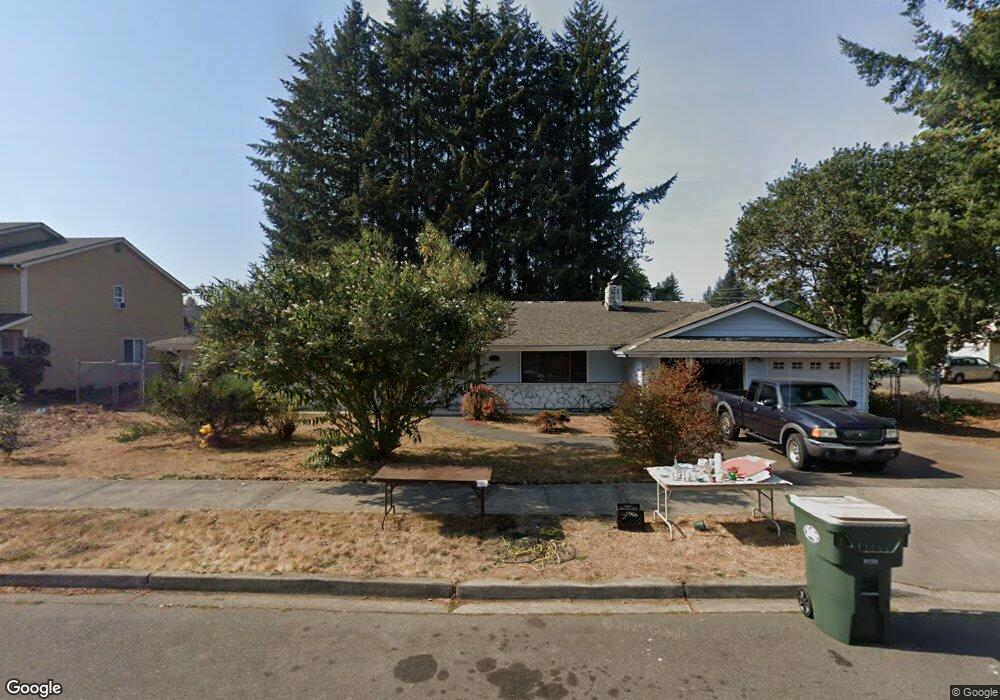
7021 Lazy Ct SW Olympia, WA 98512
Littlerock NeighborhoodEstimated Value: $520,666 - $582,000
2
Beds
2
Baths
1,794
Sq Ft
$302/Sq Ft
Est. Value
About This Home
This home is located at 7021 Lazy Ct SW, Olympia, WA 98512 and is currently estimated at $542,417, approximately $302 per square foot. 7021 Lazy Ct SW is a home located in Thurston County with nearby schools including Michael T. Simmons Elementary School, Tumwater Middle School, and A.G. West Black Hills High School.
Ownership History
Date
Name
Owned For
Owner Type
Purchase Details
Closed on
Oct 20, 2022
Sold by
Dunbar Lawrence P
Bought by
Whiton Byron Robert
Current Estimated Value
Home Financials for this Owner
Home Financials are based on the most recent Mortgage that was taken out on this home.
Original Mortgage
$276,210
Outstanding Balance
$266,956
Interest Rate
6.7%
Mortgage Type
VA
Estimated Equity
$275,461
Purchase Details
Closed on
May 27, 2021
Sold by
Dunbar Lawrence F
Bought by
Dunbar Lawrence P and Whiton Byron
Purchase Details
Closed on
May 18, 2021
Sold by
Gaubatz Sandra and Dunbar Sandra
Bought by
Dunbar Lawrence P
Purchase Details
Closed on
Apr 27, 1995
Sold by
So Hyo Jin and So Janet G
Bought by
Dunbar Lawrence P and Dunbar Sandra
Home Financials for this Owner
Home Financials are based on the most recent Mortgage that was taken out on this home.
Original Mortgage
$128,750
Interest Rate
8.44%
Mortgage Type
Assumption
Create a Home Valuation Report for This Property
The Home Valuation Report is an in-depth analysis detailing your home's value as well as a comparison with similar homes in the area
Home Values in the Area
Average Home Value in this Area
Purchase History
| Date | Buyer | Sale Price | Title Company |
|---|---|---|---|
| Whiton Byron Robert | -- | First American Title | |
| Dunbar Lawrence P | -- | None Available | |
| Dunbar Lawrence P | -- | None Available | |
| Dunbar Lawrence P | $125,000 | First American Title Ins Co |
Source: Public Records
Mortgage History
| Date | Status | Borrower | Loan Amount |
|---|---|---|---|
| Open | Whiton Byron Robert | $276,210 | |
| Previous Owner | Dunbar Lawrence P | $128,750 |
Source: Public Records
Tax History Compared to Growth
Tax History
| Year | Tax Paid | Tax Assessment Tax Assessment Total Assessment is a certain percentage of the fair market value that is determined by local assessors to be the total taxable value of land and additions on the property. | Land | Improvement |
|---|---|---|---|---|
| 2024 | $4,641 | $463,500 | $168,100 | $295,400 |
| 2023 | $4,641 | $463,600 | $153,000 | $310,600 |
| 2022 | $4,252 | $433,400 | $117,100 | $316,300 |
| 2021 | $3,987 | $354,900 | $101,200 | $253,700 |
| 2020 | $3,438 | $304,000 | $77,800 | $226,200 |
| 2019 | $3,227 | $254,400 | $67,200 | $187,200 |
| 2018 | $2,952 | $223,500 | $55,600 | $167,900 |
| 2017 | $2,851 | $211,900 | $60,200 | $151,700 |
| 2016 | $2,597 | $200,450 | $62,150 | $138,300 |
| 2014 | -- | $185,800 | $59,000 | $126,800 |
Source: Public Records
Map
Nearby Homes
- 7022 Lazy Ct SW
- 7008 Southwick Ct SW
- 2535 70th Ave SW Unit 18
- 2535 70th Ave SW Unit 9
- 2535 70th Ave SW Unit 12
- 3021 70th Way SW
- 7303 Mirasett St SW Unit Lot 30
- 7302 Jenner St SW Unit Lot 64
- 7309 Mirasett St SW Unit Lot 31
- 7049 Rothenberg Dr SW
- 6707 Miner Dr SW
- 2411 Tumwater Blvd SW
- 2880 75th Ave SW Unit Lot 62
- 7431 Jenner St SW Unit Lot 60
- 2437 73rd Ave SW
- 3140 66th Ave SW
- 7340 Prine Dr SW
- 6940 Littlerock Rd SW
- 3244 66th Ave SW Unit 33
- 6137 Kirsop Rd SW
- 7025 & 7027 Lazy Ct SW
- 7024 Mirasett St SW
- 7011 & 7017 Lazy Ct SW
- 7028 Mirasett St SW
- 7020 Mirasett St SW
- 7003 Lazy Ct SW
- 7032 Mirasett St SW
- 7031 Lazy Ct SW
- 7018 Mirasett St SW
- 7014 Lazy Ct SW
- 7036 Mirasett St SW
- 7014 Mirasett St SW
- 7030 Lazy Ct SW
- 7038 Mirasett St SW
- 7002 Lazy Ct SW
- 7035 Lazy Ct SW
- 7001 Lazy Ct SW
- 7036 Lazy Ct SW
- 6934 Southwick Ct SW
- 7042 Mirasett St SW