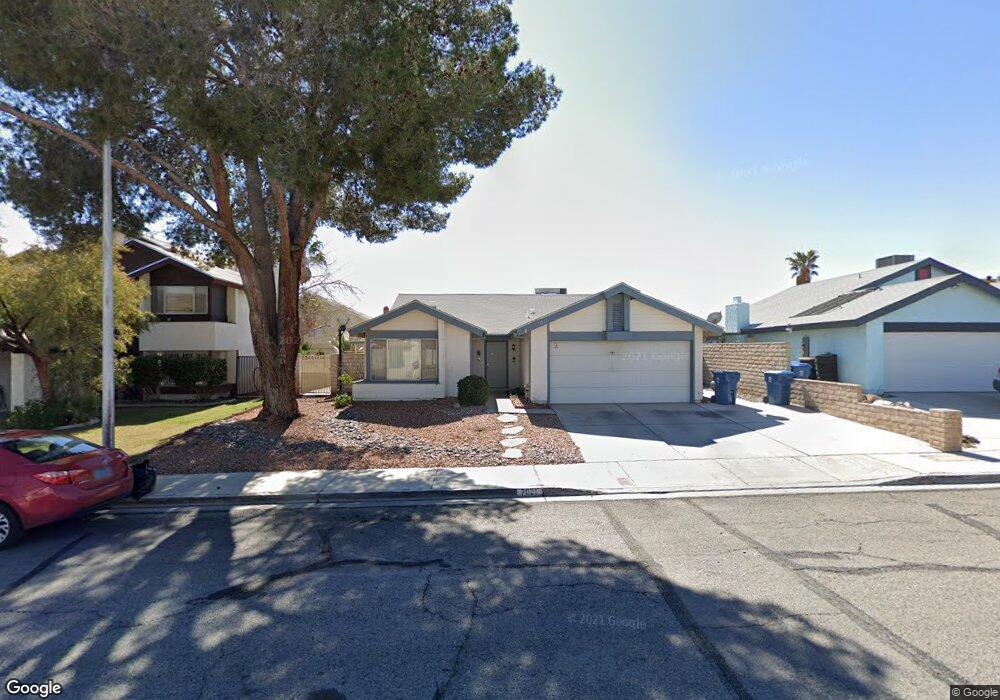
7021 Wedgewood Way Las Vegas, NV 89147
Estimated Value: $404,638 - $422,000
3
Beds
2
Baths
1,280
Sq Ft
$322/Sq Ft
Est. Value
About This Home
This home is located at 7021 Wedgewood Way, Las Vegas, NV 89147 and is currently estimated at $411,660, approximately $321 per square foot. 7021 Wedgewood Way is a home located in Clark County with nearby schools including Pat Diskin Elementary School, Clifford J Lawrence Junior High School, and Spring Valley High School.
Ownership History
Date
Name
Owned For
Owner Type
Purchase Details
Closed on
Jun 2, 2003
Sold by
Laster Samuel M
Bought by
Laster Samuel M and Gilliam Noel T
Current Estimated Value
Purchase Details
Closed on
Feb 21, 2003
Sold by
Laster Samuel M and Gilliam Noel T
Bought by
Laster Samuel M
Home Financials for this Owner
Home Financials are based on the most recent Mortgage that was taken out on this home.
Original Mortgage
$119,700
Outstanding Balance
$51,190
Interest Rate
5.93%
Estimated Equity
$360,470
Purchase Details
Closed on
Jun 24, 1997
Sold by
Moser James Edward and Moser Nancy Gayle
Bought by
Lasater Samuel M and Gilliam Noel T
Home Financials for this Owner
Home Financials are based on the most recent Mortgage that was taken out on this home.
Original Mortgage
$122,050
Interest Rate
7.91%
Mortgage Type
FHA
Create a Home Valuation Report for This Property
The Home Valuation Report is an in-depth analysis detailing your home's value as well as a comparison with similar homes in the area
Home Values in the Area
Average Home Value in this Area
Purchase History
| Date | Buyer | Sale Price | Title Company |
|---|---|---|---|
| Laster Samuel M | -- | -- | |
| Laster Samuel M | -- | Pioneer National Title | |
| Lasater Samuel M | $123,500 | Old Republic Title Company |
Source: Public Records
Mortgage History
| Date | Status | Borrower | Loan Amount |
|---|---|---|---|
| Open | Laster Samuel M | $119,700 | |
| Closed | Lasater Samuel M | $122,050 |
Source: Public Records
Tax History Compared to Growth
Tax History
| Year | Tax Paid | Tax Assessment Tax Assessment Total Assessment is a certain percentage of the fair market value that is determined by local assessors to be the total taxable value of land and additions on the property. | Land | Improvement |
|---|---|---|---|---|
| 2025 | $1,388 | $69,747 | $35,350 | $34,397 |
| 2024 | $1,348 | $69,747 | $35,350 | $34,397 |
| 2023 | $1,348 | $68,740 | $35,000 | $33,740 |
| 2022 | $1,309 | $59,065 | $27,300 | $31,765 |
| 2021 | $1,271 | $54,130 | $23,450 | $30,680 |
| 2020 | $1,231 | $54,466 | $23,450 | $31,016 |
| 2019 | $1,195 | $52,077 | $21,000 | $31,077 |
| 2018 | $1,160 | $49,778 | $19,250 | $30,528 |
| 2017 | $1,437 | $48,994 | $17,500 | $31,494 |
| 2016 | $1,100 | $44,915 | $12,600 | $32,315 |
| 2015 | $1,096 | $42,525 | $10,500 | $32,025 |
| 2014 | $1,065 | $35,215 | $8,050 | $27,165 |
Source: Public Records
Map
Nearby Homes
- 7072 Parasol Ln
- 6979 Stober Ct
- 6999 Mountain Moss Dr
- 3768 Majestic Dr
- 7015 Quarry Dr
- 7150 Mountain Moss Dr
- 7231 Sequoia Springs Dr
- 6816 Segura Dr
- 6880 Casa Linda Dr
- 6756 Endora Dr
- 7225 Bridgeview Ave
- 3974 Round Wood St
- 3785 Redwood St
- 6761 Bonillo Dr
- 7137 Flowering Rose Ave
- 6741 Bonillo Dr
- 3533 Moraga Dr
- 7400 W Flamingo Rd Unit 1071
- 7400 W Flamingo Rd Unit 2094
- 7400 W Flamingo Rd Unit 2033
- 7011 Wedgewood Way
- 7031 Wedgewood Way
- 7018 Stober Ct
- 7008 Stober Ct
- 7001 Wedgewood Way
- 7041 Wedgewood Way
- 7028 Stober Ct
- 7020 Wedgewood Way
- 7010 Wedgewood Way
- 7030 Wedgewood Way
- 6991 Wedgewood Way
- 7051 Wedgewood Way
- 3836 Sebasco Dr Unit 8
- 7000 Wedgewood Way Unit 8
- 7040 Wedgewood Way
- 6988 Stober Ct
- 3846 Sebasco Dr
- 7029 Stober Ct
- 6990 Wedgewood Way