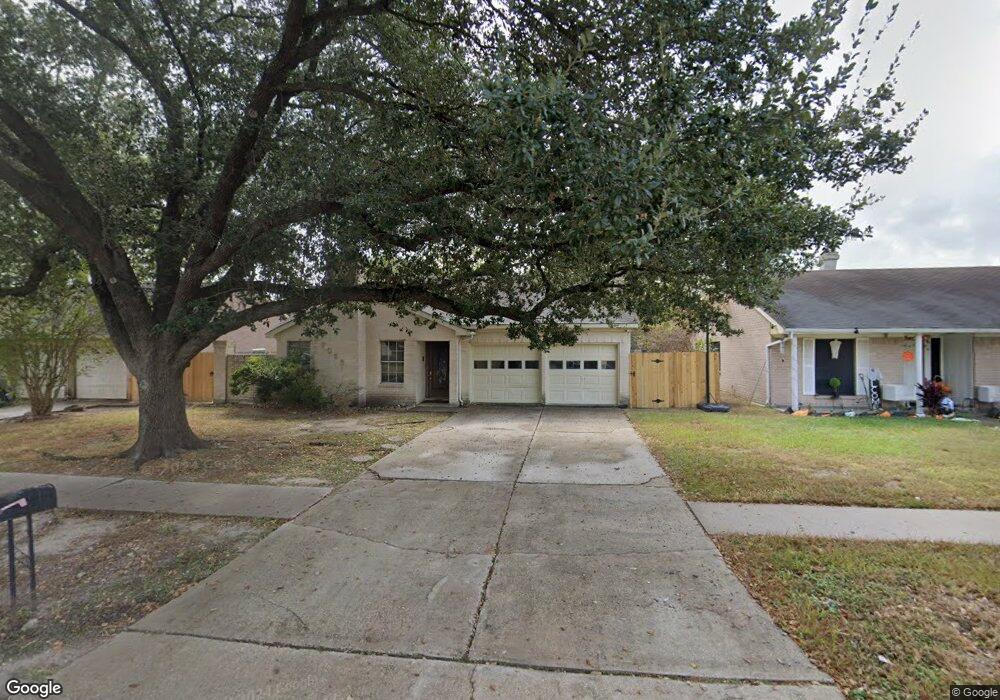
7023 Canyon Way Dr Houston, TX 77086
North Houston NeighborhoodEstimated Value: $240,575 - $252,000
4
Beds
3
Baths
1,998
Sq Ft
$122/Sq Ft
Est. Value
About This Home
This home is located at 7023 Canyon Way Dr, Houston, TX 77086 and is currently estimated at $244,644, approximately $122 per square foot. 7023 Canyon Way Dr is a home located in Harris County with nearby schools including Kujawa EC/Pre-K/K School, Carmichael Elementary School, and Shotwell Middle School.
Ownership History
Date
Name
Owned For
Owner Type
Purchase Details
Closed on
Aug 18, 2015
Sold by
Alvarez Felix and Alvarez Feliux Ulises
Bought by
Fuentes Sagrario C
Current Estimated Value
Purchase Details
Closed on
Jun 18, 2001
Sold by
Fuentes Felipe S and Fuentes Cecilia Isabel
Bought by
Alvarez Felix and Fuentes Sagrario C
Home Financials for this Owner
Home Financials are based on the most recent Mortgage that was taken out on this home.
Original Mortgage
$53,989
Interest Rate
7.2%
Purchase Details
Closed on
May 26, 1994
Sold by
Federal National Mortgage Association
Bought by
Fuentes Felipe S and Fuentes Sagrario C
Home Financials for this Owner
Home Financials are based on the most recent Mortgage that was taken out on this home.
Original Mortgage
$54,600
Interest Rate
8.45%
Purchase Details
Closed on
Dec 7, 1993
Sold by
Shaw Jo E
Bought by
Federal National Mortgage Association
Create a Home Valuation Report for This Property
The Home Valuation Report is an in-depth analysis detailing your home's value as well as a comparison with similar homes in the area
Home Values in the Area
Average Home Value in this Area
Purchase History
| Date | Buyer | Sale Price | Title Company |
|---|---|---|---|
| Fuentes Sagrario C | -- | Attorney | |
| Alvarez Felix | -- | Alamo Title Company | |
| Fuentes Felipe S | -- | Title Agency #40 | |
| Federal National Mortgage Association | -- | -- |
Source: Public Records
Mortgage History
| Date | Status | Borrower | Loan Amount |
|---|---|---|---|
| Previous Owner | Alvarez Felix | $53,989 | |
| Previous Owner | Fuentes Felipe S | $54,600 |
Source: Public Records
Tax History Compared to Growth
Tax History
| Year | Tax Paid | Tax Assessment Tax Assessment Total Assessment is a certain percentage of the fair market value that is determined by local assessors to be the total taxable value of land and additions on the property. | Land | Improvement |
|---|---|---|---|---|
| 2025 | $3,389 | $241,786 | $39,135 | $202,651 |
| 2024 | $3,389 | $245,470 | $39,135 | $206,335 |
| 2023 | $3,389 | $235,110 | $39,135 | $195,975 |
| 2022 | $4,077 | $195,223 | $33,165 | $162,058 |
| 2021 | $3,698 | $162,616 | $33,165 | $129,451 |
| 2020 | $3,737 | $154,152 | $33,165 | $120,987 |
| 2019 | $3,532 | $150,557 | $16,912 | $133,645 |
| 2018 | $1,284 | $140,489 | $16,912 | $123,577 |
| 2017 | $2,815 | $104,000 | $15,187 | $88,813 |
| 2016 | $3,482 | $128,666 | $15,187 | $113,479 |
| 2015 | $1,867 | $119,431 | $15,187 | $104,244 |
| 2014 | $1,867 | $89,477 | $15,187 | $74,290 |
Source: Public Records
Map
Nearby Homes
- 7218 Winding Trace Dr
- 7002 Sandswept Ln
- 7023 Sandswept Ln
- 7222 Northleaf Dr
- 11007 Tobasa Ct
- 7227 Greenyard Dr
- 10614 Mackenzie Dr
- 10711 Heather Hill Dr
- 6722 Winding Trace Dr
- 10723 Mackenzie Dr
- 11006 Crinkleawn Dr
- 6654 Brownie Campbell Rd
- 10307 Bammel North Houston Rd
- 6911 Silver Star Dr
- 6630 Brownie Campbell Rd
- 11021 Crenchrus Ct
- 11009 Panicum Ct
- 6610 Northleaf Dr
- 7302 Seton Lake Dr
- 6615 Winding Trace Dr
- 7019 Canyon Way Dr
- 7103 Canyon Way Dr
- 7022 Winding Trace Dr
- 7018 Winding Trace Dr
- 7015 Canyon Way Dr
- 7107 Canyon Way Dr
- 7102 Winding Trace Dr
- 7014 Winding Trace Dr
- 7106 Winding Trace Dr
- 7022 Canyon Way Dr
- 7018 Canyon Way Dr
- 7011 Canyon Way Dr
- 7102 Canyon Way Dr
- 7111 Canyon Way Dr
- 7010 Winding Trace Dr
- 7014 Canyon Way Dr
- 7106 Canyon Way Dr
- 7110 Winding Trace Dr
- 7007 Canyon Way Dr
- 7010 Canyon Way Dr