7023 Key St Savannah, GA 31406
Norwood-Wylly Island NeighborhoodEstimated Value: $225,901 - $265,000
About This Home
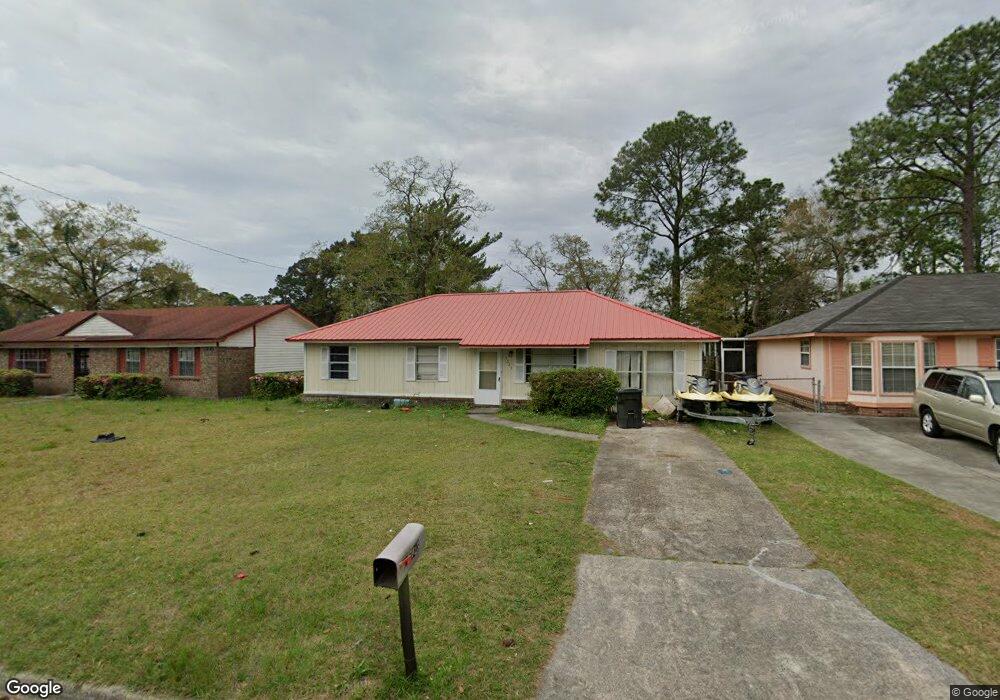
This home is located at 7023 Key St, Savannah, GA 31406 and is currently estimated at $246,725, approximately $197 per square foot. 7023 Key St is a home located in Chatham County with nearby schools including Isle Of Hope School, Johnson High School, and Oglethorpe Charter School.
Ownership History
We collect this data history from publicly available records. To have your information removed, we recommend requesting removal directly through your county’s website.
Purchase Details
Home Financials for this Owner
Home Financials are based on the most recent Mortgage that was taken out on this home.Home Values in the Area
Average Home Value in this Area
Purchase History
We collect this data history from publicly available records. To have your information removed, we recommend requesting removal directly through your county’s website.
| Date | Buyer | Sale Price | Title Company |
|---|---|---|---|
| -- | -- |
Mortgage History
We collect this data history from publicly available records. To have your information removed, we recommend requesting removal directly through your county’s website.
| Date | Status | Borrower | Loan Amount |
|---|---|---|---|
| Closed | $79,217 |
Tax History
We collect this data history from publicly available records. To have your information removed, we recommend requesting removal directly through your county’s website.
| Year | Tax Paid | Tax Assessment Tax Assessment Total Assessment is a certain percentage of the fair market value that is determined by local assessors to be the total taxable value of land and additions on the property. | Land | Improvement |
|---|---|---|---|---|
| 2025 | $2,249 | $52,840 | $20,000 | $32,840 |
| 2024 | $14 | $53,120 | $20,000 | $33,120 |
| 2023 | $1,434 | $39,240 | $12,920 | $26,320 |
| 2022 | $1,508 | $47,200 | $12,920 | $34,280 |
| 2021 | $1,580 | $42,320 | $12,920 | $29,400 |
| 2020 | $1,438 | $42,160 | $12,920 | $29,240 |
| 2019 | $2,237 | $39,400 | $12,920 | $26,480 |
| 2018 | $1,523 | $39,080 | $12,920 | $26,160 |
| 2017 | $1,527 | $39,440 | $12,920 | $26,520 |
| 2016 | $1,468 | $42,800 | $12,920 | $29,880 |
| 2015 | $1,509 | $43,960 | $12,920 | $31,040 |
| 2014 | $2,010 | $45,240 | $0 | $0 |
Map
- 4 Cross Bow Ct
- 126 S Robinhood Dr
- 7221 Garfield St
- 6929 Key St
- 139 Carolines Retreat
- 7308 Garfield St
- 32 Brookview Dr
- 111 Hope Ln
- 27 Sidney Dr
- 0 Albert St Unit SA337026
- 7317 Leghorn St
- 8 Chestley Place
- 25 Ralston's Way
- 3 Mulberry Ct
- 11 Norwood Ct
- 8 Norwood Ct
- 122 Canter Ct
- 7340 Garfield St
- 6808 La Roche Ave Unit 4
- 117 Canter Ct
Ask me questions while you tour the home.