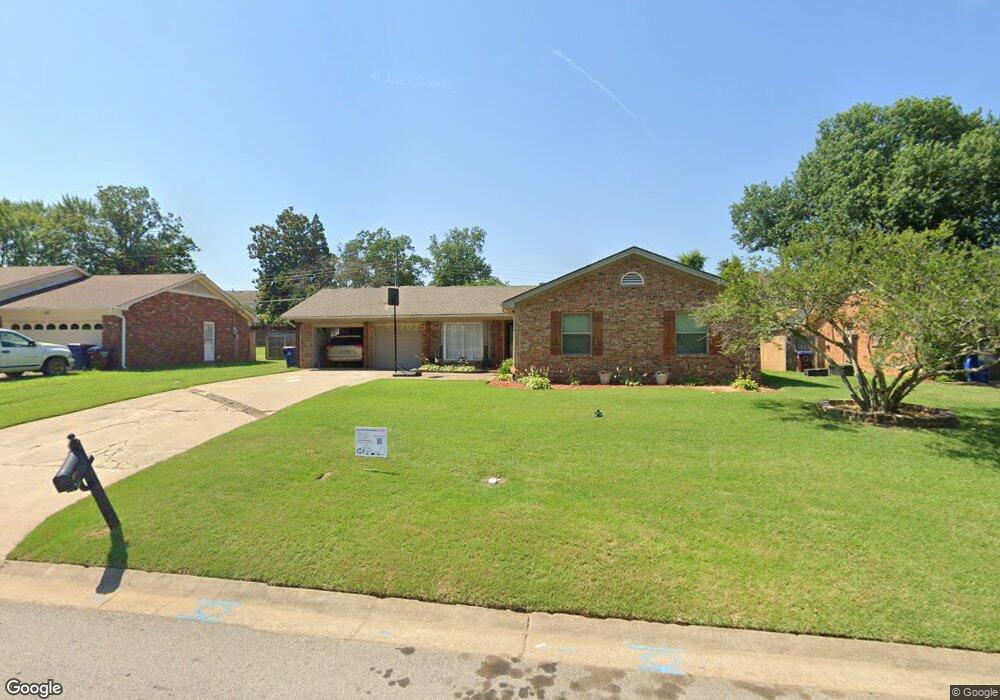
7024 S T St Fort Smith, AR 72903
Estimated Value: $239,000 - $287,000
--
Bed
2
Baths
2,394
Sq Ft
$111/Sq Ft
Est. Value
About This Home
This home is located at 7024 S T St, Fort Smith, AR 72903 and is currently estimated at $266,078, approximately $111 per square foot. 7024 S T St is a home located in Sebastian County with nearby schools including Euper Lane Elementary School, L.A. Chaffin Junior High School, and Southside High School.
Ownership History
Date
Name
Owned For
Owner Type
Purchase Details
Closed on
Apr 1, 2021
Sold by
Bryson H Wayne
Bought by
Pece Kristin
Current Estimated Value
Home Financials for this Owner
Home Financials are based on the most recent Mortgage that was taken out on this home.
Original Mortgage
$187,000
Interest Rate
2.9%
Mortgage Type
Credit Line Revolving
Purchase Details
Closed on
Mar 29, 2010
Sold by
Collins James L
Bought by
Skurdahl Nathan and Skurdahl Brittney
Home Financials for this Owner
Home Financials are based on the most recent Mortgage that was taken out on this home.
Original Mortgage
$131,773
Interest Rate
4.93%
Mortgage Type
VA
Purchase Details
Closed on
Jan 12, 1993
Bought by
Genaro Beverly A
Purchase Details
Closed on
Feb 14, 1986
Bought by
Selig Jimmy C and Mary Ann
Purchase Details
Closed on
Dec 19, 1983
Bought by
Lee Richard C and Lee Barbara L
Create a Home Valuation Report for This Property
The Home Valuation Report is an in-depth analysis detailing your home's value as well as a comparison with similar homes in the area
Home Values in the Area
Average Home Value in this Area
Purchase History
| Date | Buyer | Sale Price | Title Company |
|---|---|---|---|
| Pece Kristin | $161,000 | Pci Durham Title | |
| Skurdahl Nathan | $129,000 | Stewart Title Guaranty Co | |
| Genaro Beverly A | $82,000 | -- | |
| Selig Jimmy C | $69,000 | -- | |
| Lee Richard C | $67,000 | -- |
Source: Public Records
Mortgage History
| Date | Status | Borrower | Loan Amount |
|---|---|---|---|
| Closed | Pece Kristin | $187,000 | |
| Previous Owner | Skurdahl Nathan | $131,773 |
Source: Public Records
Tax History Compared to Growth
Tax History
| Year | Tax Paid | Tax Assessment Tax Assessment Total Assessment is a certain percentage of the fair market value that is determined by local assessors to be the total taxable value of land and additions on the property. | Land | Improvement |
|---|---|---|---|---|
| 2024 | $1,920 | $36,575 | $8,000 | $28,575 |
| 2023 | $1,698 | $36,575 | $8,000 | $28,575 |
| 2022 | $1,714 | $36,575 | $8,000 | $28,575 |
| 2021 | $1,376 | $32,130 | $8,000 | $24,130 |
| 2020 | $1,296 | $32,130 | $8,000 | $24,130 |
| 2019 | $1,217 | $27,420 | $8,000 | $19,420 |
| 2018 | $1,242 | $27,420 | $8,000 | $19,420 |
| 2017 | $1,090 | $27,420 | $8,000 | $19,420 |
| 2016 | $1,440 | $27,420 | $8,000 | $19,420 |
| 2015 | $1,090 | $27,420 | $8,000 | $19,420 |
| 2014 | $1,044 | $26,550 | $5,700 | $20,850 |
Source: Public Records
Map
Nearby Homes
- 7024 S U St
- 2100 S 70th St
- 15640 S 71st St
- 7315 Riviera Dr
- 7709 Camelot Cir
- 6501 Rogers Ave
- 2211 S 64th St
- 1701 S 66th St
- 2 Laurel Glen
- 5611 and 5613 Duncan Rd
- 3621 Rogers Ave
- 6411 Atlanta St
- 2604 S 65th St
- 6409 Boston St
- 6307 Atlanta St
- 7718 Williamsburg Rd
- 7906 Valley Forge Rd
- 1204 Kensington Way
- 6408 Carthage St
- 6004 S Y St