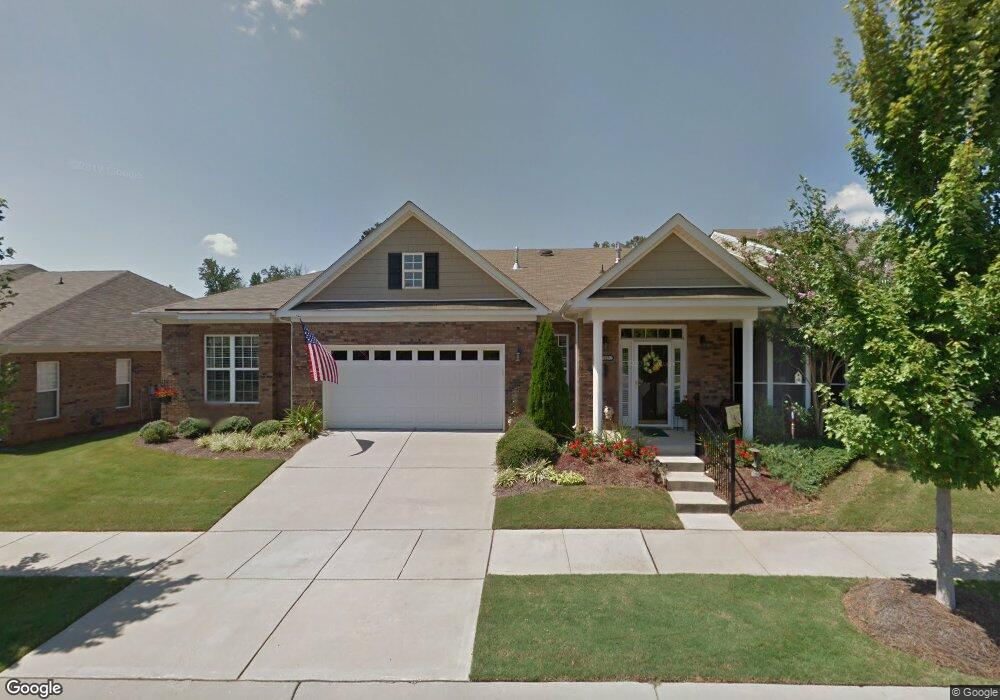
7025 Cinnamon Cir Unit 1B Mint Hill, NC 28227
Estimated Value: $344,000 - $372,000
2
Beds
2
Baths
1,757
Sq Ft
$206/Sq Ft
Est. Value
About This Home
This home is located at 7025 Cinnamon Cir Unit 1B, Mint Hill, NC 28227 and is currently estimated at $361,379, approximately $205 per square foot. 7025 Cinnamon Cir Unit 1B is a home located in Mecklenburg County with nearby schools including Lebanon Road Elementary, Northeast Middle, and Independence High.
Ownership History
Date
Name
Owned For
Owner Type
Purchase Details
Closed on
Feb 16, 2015
Sold by
Rudden Elberteen E
Bought by
Harris Janis S
Current Estimated Value
Purchase Details
Closed on
Sep 26, 2012
Sold by
Elliottes Enterprises Llc
Bought by
Rudden Elberteen E
Home Financials for this Owner
Home Financials are based on the most recent Mortgage that was taken out on this home.
Original Mortgage
$60,000
Interest Rate
3.68%
Mortgage Type
Purchase Money Mortgage
Purchase Details
Closed on
Jun 22, 2012
Sold by
Elliotte John J and Elliotte Charlotte R
Bought by
Elliottes Enterprise Llc
Purchase Details
Closed on
Jul 7, 2008
Sold by
Portrait Homes Traditions At Lawyers Gle
Bought by
Elliotte John J and Elliotte Charlotte R
Home Financials for this Owner
Home Financials are based on the most recent Mortgage that was taken out on this home.
Original Mortgage
$217,898
Interest Rate
6.08%
Mortgage Type
Purchase Money Mortgage
Create a Home Valuation Report for This Property
The Home Valuation Report is an in-depth analysis detailing your home's value as well as a comparison with similar homes in the area
Home Values in the Area
Average Home Value in this Area
Purchase History
| Date | Buyer | Sale Price | Title Company |
|---|---|---|---|
| Harris Janis S | $182,500 | None Available | |
| Rudden Elberteen E | $220,000 | None Available | |
| Elliottes Enterprise Llc | -- | None Available | |
| Elliotte John J | $242,500 | None Available |
Source: Public Records
Mortgage History
| Date | Status | Borrower | Loan Amount |
|---|---|---|---|
| Previous Owner | Rudden Elberteen E | $60,000 | |
| Previous Owner | Elliotte John J | $217,898 |
Source: Public Records
Tax History Compared to Growth
Tax History
| Year | Tax Paid | Tax Assessment Tax Assessment Total Assessment is a certain percentage of the fair market value that is determined by local assessors to be the total taxable value of land and additions on the property. | Land | Improvement |
|---|---|---|---|---|
| 2025 | $2,366 | $327,200 | $70,000 | $257,200 |
| 2024 | $2,366 | $327,200 | $70,000 | $257,200 |
| 2023 | $2,329 | $327,200 | $70,000 | $257,200 |
| 2022 | $2,022 | $227,400 | $40,000 | $187,400 |
| 2021 | $2,022 | $227,400 | $40,000 | $187,400 |
| 2020 | $2,022 | $227,400 | $40,000 | $187,400 |
| 2019 | $2,016 | $227,400 | $40,000 | $187,400 |
| 2018 | $2,124 | $191,800 | $26,000 | $165,800 |
| 2017 | $2,106 | $191,800 | $26,000 | $165,800 |
| 2016 | $2,103 | $191,800 | $26,000 | $165,800 |
| 2015 | $2,099 | $191,800 | $26,000 | $165,800 |
| 2014 | $2,097 | $182,900 | $26,000 | $156,900 |
Source: Public Records
Map
Nearby Homes
- 6815 Cinnamon Cir Unit 6C
- 10711 Reid Alexander Ln
- 6918 Cinnamon Cir
- 7230 Truelight Church Rd
- 4303 Patriots Hill Rd
- 15018 Camus Ct
- 10200 Atchinson Dr
- 7445 Forrest Rader Dr
- 10501 Olde Irongate Ln
- 6545 Old Magnolia Ln
- 3215 Lisburn St
- 5331 Chicopee Dr
- 7710 Grove Hall Ave
- 13216 Lawyers Rd
- 8245 Franklin Trail St
- 4119 Roe Creek Dr
- Woodwright Plan at Alton Creek
- Henderson Plan at Alton Creek
- Banks Plan at Alton Creek
- Allen Plan at Alton Creek
- 10736 Ryan Courtney Square Unit 3014
- 10736 Ryan Courtney Square Unit 17C
- 7029 Cinnamon Cir Unit 1A
- 10730 Ryan Courtney Square
- 10740 Ryan Courtney Square
- 7026 Cinnamon Cir
- 7015 Cinnamon Cir Unit 2B
- 10737 Ryan Courtney Square Unit 3B
- 10726 Ryan Courtney Square Unit 2C
- 10731 Ryan Courtney Square Unit 6A
- 10741 Ryan Courtney Square
- 6720 Cinnamon Cir Unit 17B
- 6724 Cinnamon Cir
- 6805 Cinnamon Cir Unit 17C
- 7009 Cinnamon Cir
- 6811 Cinnamon Cir Unit 6D
- 6716 Cinnamon Cir Unit 17C
- 6730 Cinnamon Cir
- 10720 Ryan Courtney Square
- 6734 Cinnamon Cir