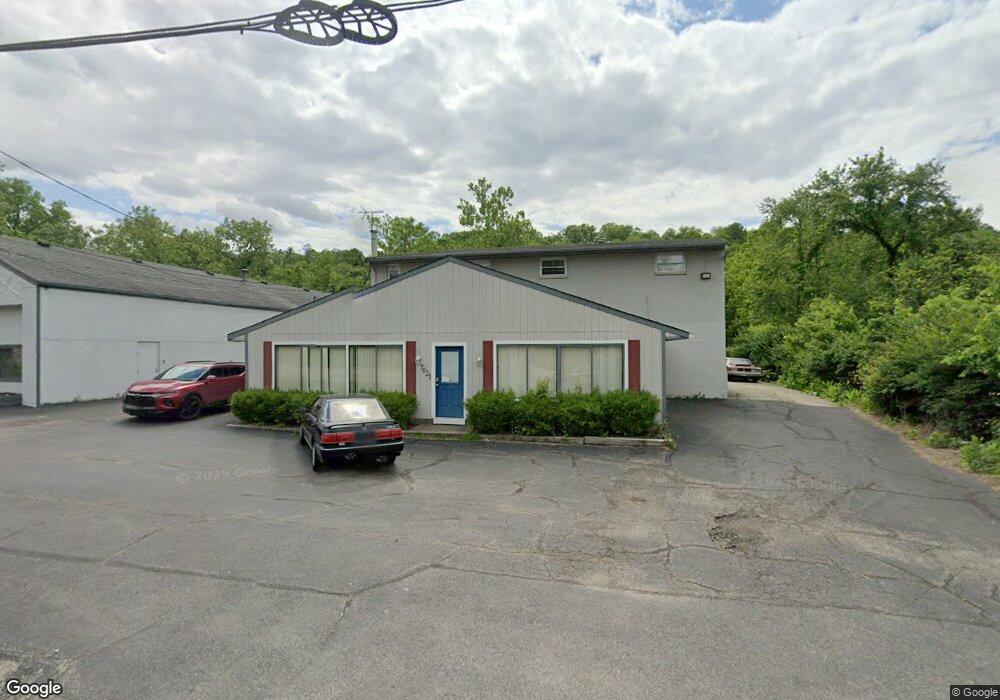
7025 Harrison Ave Cincinnati, OH 45247
Estimated Value: $193,749
Studio
--
Bath
2,423
Sq Ft
$80/Sq Ft
Est. Value
About This Home
This home is located at 7025 Harrison Ave, Cincinnati, OH 45247 and is currently estimated at $193,749, approximately $79 per square foot. 7025 Harrison Ave is a home located in Hamilton County with nearby schools including Charles W Springmyer Elementary School, Bridgetown Middle School, and Oak Hills High School.
Ownership History
Date
Name
Owned For
Owner Type
Purchase Details
Closed on
Dec 19, 2019
Sold by
Gramke James F and Gramke Teresa M
Bought by
Blue Window Llc
Current Estimated Value
Purchase Details
Closed on
Jun 27, 2019
Sold by
B & G Gilbet Propertis Llc
Bought by
Gramke James F
Purchase Details
Closed on
May 22, 2001
Sold by
Gilbert Gary W and Gilbert Beverly J
Bought by
B & G Gilbert Properties Llc
Purchase Details
Closed on
Jan 3, 2000
Sold by
Gilbert Gary W and Gilbert Beverly J
Bought by
Gilbert Gary W and Gilbert Beverly J
Home Financials for this Owner
Home Financials are based on the most recent Mortgage that was taken out on this home.
Original Mortgage
$201,600
Interest Rate
7.76%
Mortgage Type
Commercial
Create a Home Valuation Report for This Property
The Home Valuation Report is an in-depth analysis detailing your home's value as well as a comparison with similar homes in the area
Home Values in the Area
Average Home Value in this Area
Purchase History
| Date | Buyer | Sale Price | Title Company |
|---|---|---|---|
| Blue Window Llc | -- | None Available | |
| Gramke James F | $125,000 | None Available | |
| B & G Gilbert Properties Llc | -- | -- | |
| Gilbert Gary W | $200,000 | -- |
Source: Public Records
Mortgage History
| Date | Status | Borrower | Loan Amount |
|---|---|---|---|
| Previous Owner | Gilbert Gary W | $201,600 |
Source: Public Records
Tax History
| Year | Tax Paid | Tax Assessment Tax Assessment Total Assessment is a certain percentage of the fair market value that is determined by local assessors to be the total taxable value of land and additions on the property. | Land | Improvement |
|---|---|---|---|---|
| 2025 | $4,439 | $65,027 | $16,947 | $48,080 |
| 2023 | $4,371 | $65,027 | $16,947 | $48,080 |
| 2022 | $3,346 | $43,751 | $15,838 | $27,913 |
| 2021 | $3,119 | $43,751 | $15,838 | $27,913 |
| 2020 | $3,248 | $43,751 | $15,838 | $27,913 |
| 2019 | $5,068 | $68,968 | $15,376 | $53,592 |
| 2018 | $5,048 | $68,968 | $15,376 | $53,592 |
| 2017 | $4,817 | $68,968 | $15,376 | $53,592 |
| 2016 | $4,975 | $70,505 | $15,782 | $54,723 |
| 2015 | $4,972 | $70,505 | $15,782 | $54,723 |
| 2014 | $4,956 | $70,505 | $15,782 | $54,723 |
| 2013 | $4,837 | $72,685 | $16,268 | $56,417 |
Source: Public Records
Map
Nearby Homes
- 0 Springdale Rd Unit 1869596
- 7007 Boulder Path Dr
- 8060 Bridge Point Dr
- 7216 Creekview Dr
- 7284 Harrison Ave
- 7240 Creekview Dr
- 7298 Harrison Ave
- 5725 Lofty View Ln Unit 1C
- 6780 Harrison Ave
- 7880 Austin Ridge Dr
- 6594 Springdale Rd
- 5632 Sarahs Oak Dr
- 6864 Ruwes Oak Dr
- 5473 Michelles Oak Ct
- 5401 Michelles Oak Ct
- 6384 Conifer Ln
- 7970 Valley Crossing Dr
- 6793 Jennifer Lynn Dr
- 5310 Rybolt Rd
- 5089 Greenshire Dr
- 7033 Harrison Ave
- 7037 Harrison Ave
- 7016 Harrison Ave
- 7036 Harrison Ave
- 7007 Harrison Ave
- 7007 Harrison Ave
- 7007 Harrison Ave
- 7012 Harrison Ave
- 7012 Harrison Ave Unit 6
- 7050 Harrison Ave
- 7008 Harrison Ave
- 7022 Mullen Rd
- 6997 Harrison Ave
- 7060 Harrison Ave
- 7018 Mullen Rd
- 7070 Harrison Ave
- 6989 Harrison Ave
- 6993 Aspen Point Ct
- 6993 Aspen Point Ct Unit 26B
- 6993 Aspen Point Ct Unit COURT
Your Personal Tour Guide
Ask me questions while you tour the home.