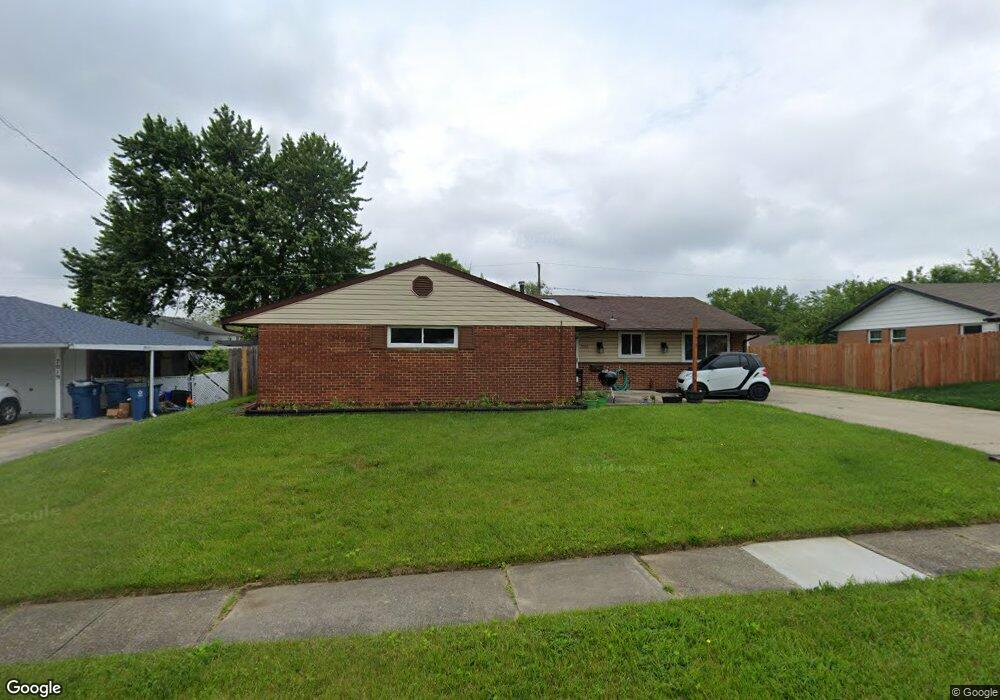
7025 Klyemore Dr Dayton, OH 45424
Estimated Value: $227,000 - $239,000
4
Beds
2
Baths
1,755
Sq Ft
$132/Sq Ft
Est. Value
About This Home
This home is located at 7025 Klyemore Dr, Dayton, OH 45424 and is currently estimated at $232,310, approximately $132 per square foot. 7025 Klyemore Dr is a home located in Montgomery County with nearby schools including Wayne High School and Huber Heights Christian Academy.
Ownership History
Date
Name
Owned For
Owner Type
Purchase Details
Closed on
Aug 26, 2019
Sold by
Sands Samantha J
Bought by
Isaacs Mason B
Current Estimated Value
Purchase Details
Closed on
Nov 8, 2018
Sold by
Lazaruis Christopher L and Lazaruis Angela D
Bought by
Isaacs Mason B and Sands Samantha J
Home Financials for this Owner
Home Financials are based on the most recent Mortgage that was taken out on this home.
Original Mortgage
$116,303
Interest Rate
4.8%
Mortgage Type
New Conventional
Purchase Details
Closed on
Feb 18, 2016
Sold by
Smith Terry Lee
Bought by
Lazaruis Christopher L and Lazaruis Angela D
Home Financials for this Owner
Home Financials are based on the most recent Mortgage that was taken out on this home.
Original Mortgage
$106,236
Interest Rate
3.81%
Mortgage Type
VA
Purchase Details
Closed on
Dec 3, 1993
Sold by
Smith Diane E
Bought by
Smith Terry Lee
Create a Home Valuation Report for This Property
The Home Valuation Report is an in-depth analysis detailing your home's value as well as a comparison with similar homes in the area
Home Values in the Area
Average Home Value in this Area
Purchase History
| Date | Buyer | Sale Price | Title Company |
|---|---|---|---|
| Isaacs Mason B | -- | Midwest Ohio Title Agency | |
| Isaacs Mason B | $119,900 | Ncidulest Ohis Title | |
| Lazaruis Christopher L | $104,000 | Vantage Land Title | |
| Smith Terry Lee | -- | -- |
Source: Public Records
Mortgage History
| Date | Status | Borrower | Loan Amount |
|---|---|---|---|
| Previous Owner | Isaacs Mason B | $116,303 | |
| Previous Owner | Lazaruis Christopher L | $106,236 |
Source: Public Records
Tax History Compared to Growth
Tax History
| Year | Tax Paid | Tax Assessment Tax Assessment Total Assessment is a certain percentage of the fair market value that is determined by local assessors to be the total taxable value of land and additions on the property. | Land | Improvement |
|---|---|---|---|---|
| 2024 | $2,897 | $55,410 | $10,150 | $45,260 |
| 2023 | $2,897 | $55,410 | $10,150 | $45,260 |
| 2022 | $2,545 | $38,170 | $7,000 | $31,170 |
| 2021 | $2,527 | $38,170 | $7,000 | $31,170 |
| 2020 | $2,529 | $38,170 | $7,000 | $31,170 |
| 2019 | $2,407 | $32,110 | $7,000 | $25,110 |
| 2018 | $2,415 | $32,110 | $7,000 | $25,110 |
| 2017 | $2,399 | $32,110 | $7,000 | $25,110 |
| 2016 | $2,272 | $29,630 | $7,000 | $22,630 |
| 2015 | $2,243 | $29,630 | $7,000 | $22,630 |
| 2014 | $2,243 | $29,630 | $7,000 | $22,630 |
| 2012 | -- | $31,850 | $8,750 | $23,100 |
Source: Public Records
Map
Nearby Homes
- 7150 Harshmanville Rd
- 7126 Mandrake Dr
- 6245 Longford Rd
- 7371 Damascus Dr
- 6601 Grovehill Dr
- 6447 Highbury Rd
- 6800 Cicero Ct
- 6605 Highbury Rd
- 6946 Hubbard Dr
- 6150 Taylorsville Rd
- 6673 Celestine St
- 6811 Highbury Rd
- 6413 Alter Rd
- 7247 Camrose Ct
- 6701 Springport Way
- 6681 Spokane Dr
- 6529 Harshmanville Rd
- 5631 Longford Rd
- 5582 Camerford Dr
- 5926 Chambersburg Rd
- 7019 Klyemore Dr
- 7031 Klyemore Dr
- 7136 Kismet Place
- 7142 Kismet Place
- 7130 Kismet Place
- 7013 Klyemore Dr
- 7148 Kismet Place
- 7022 Klyemore Dr
- 7028 Klyemore Dr
- 7119 Klyemore Dr
- 7016 Klyemore Dr
- 7124 Kismet Place
- 7154 Kismet Place
- 7125 Klyemore Dr
- 7007 Klyemore Dr
- 7134 Klyemore Dr
- 7010 Klyemore Dr
- 7116 Kismet Place
- 7143 Kismet Place
- 7137 Kismet Place